Life for people in Scotland in 2016
A National Statistics Publication for Scotland
The proportion of households in the private rented sector continues to grow. Over half of all adults were managing well financially and most households had internet access at home. Combined satisfaction with local services was declining. Over half of adults view climate change as an immediate and urgent problem and more households are now disposing of their food waste in local authority-provided food caddies. Recreational walking has risen and continues to be the most common type of physical activity. There are high and increasing levels of cultural participation in Scotland.
These are just some of the findings from the wide-ranging 2016 Scottish Household Survey. The survey has been designed to provide reliable and up-to-date information on the composition, characteristics, attitudes and behaviour of Scottish households and individuals since 1999.
Scotland’s Chief Statistician today published the Scottish Household Survey (SHS) 2016 Annual Report (Scotland’s People) as well as the Scottish Household Survey (SHS) 2016 Key Findings . This is a web-only publication and can be found on the Scottish Government Website, at http://www.gov.scot/Publications/2017/09/9979
Some key findings from each chapter of the report are:
Housing
• The total number of households in Scotland has increased by 12 per cent from 2.19 million households in 1999 to 2.45 million households in 2016.
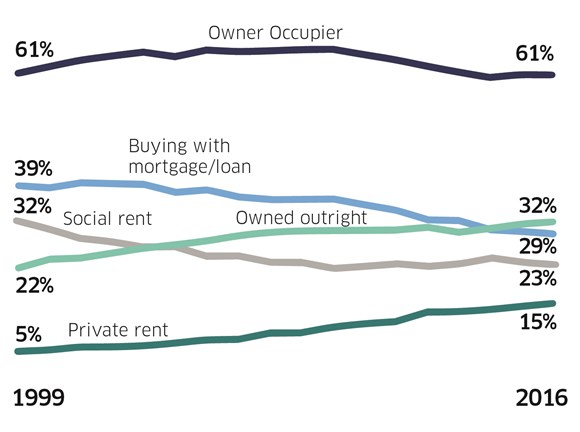
• The proportion of households in the private rented sector has grown steadily from 5 per cent in 1999 to 15 per cent in 2016, an estimated increase of 250,000 households.
• The percentage of households in the social rented sector declined from 32 per cent in 1999 to 23 per cent in 2007, an estimated drop of 150,000 households, and has remained at around 23 per cent of all households since then.
• The percentage of households in owner occupation grew from 61 per cent in 1999 to 66 per cent in 2005, but then declined by an estimated 90,000 households between 2009 and 2014 to 60 per cent. The level was around the same in 2015 and 2016 at 61 per cent.
Neighbourhoods
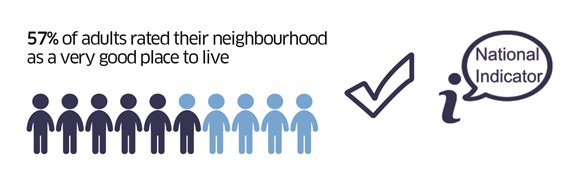
• Over nine in ten adults view their neighbourhood as a very or fairly good place to live.
• The majority of adults in Scotland (56.7 per cent) rated their neighbourhood as a very good place to live in 2016. Overall ratings of neighbourhoods have been consistently high since the SHS began in 1999. The proportion of adults who described their neighbourhood as very or fairly good in 2016 (95 per cent) was significantly higher than in each individual year between 1999 and 2013.
• Neighbourhood ratings vary depending how deprived the area is. Adults in less deprived areas are more likely to rate their neighbourhood as a very good place to live. This has been a consistent finding in recent years.
• There is a large gap in neighbourhood ratings between those living in the most and least deprived areas, although the gap is narrowing over time.
Economic Activity
Note
In work includes full and part-time employment and the self-employed. Based on adults aged 16+.
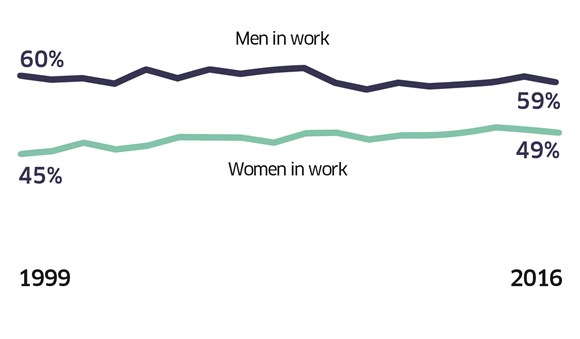
• A higher proportion of all adult men aged 16+ (59 per cent) than women (49 per cent) were currently in work. Women were more likely to be in part-time employment than men (15 compared with 4 per cent). In contrast, self-employment was more common among men than women (eight and four per cent, respectively).
• Since 1999, the proportion of working-age adults employed full-time has been stable at around 45 per cent. Recently this has increased from 45 per cent in 2012 to 48 per cent in 2016. Part time employment has remained stable over time, at around 12 per cent in 2016. During this time, the proportion of working-age adults looking after the home or family decreased from nine to seven per cent while the number of working-age adults being self-employed increased from six to eight per cent.
• Over seven in ten (71 per cent) adult men of 16-64 year olds were currently engaged in some form of paid work.
• Whilst the SHS 2016 annual report does present some estimates related to economic activity, the official and most up-to-date source of statistics on employment, unemployment and economic activity is the Labour Force Survey for Scotland and the Annual Population Survey at a local authority level. Results from both surveys are available from the Scottish Government website: http://www.gov.scot/Topics/Statistics/Browse/Labour-Market
Household Finances
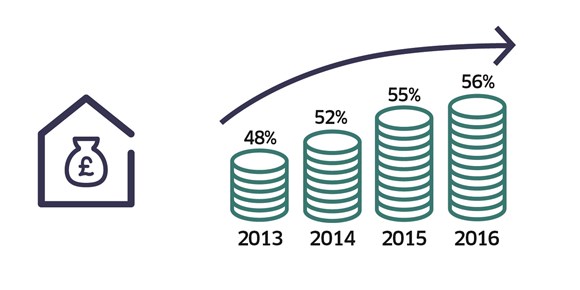
• Between 1999 and 2007 there was a general increase in the proportion of households that reported positively about their household finances, rising from 42 per cent of households in 1999 to more than a half (53 per cent) in 2007. Between 2007 and 2010 this proportion fell to around a half of all households and remained stable until 2013. In 2016, over a half of households (56 per cent) reported they managed very or quite well, this has gradually increased from 48 per cent in 2013.
Households who manage well over time
• More households on lower incomes (up to £10,000) said they did not manage well than those on higher incomes.
• Single parent households were the most likely to report that they were not managing well financially.
• Another group above the Scotland average were single adult households with around one in six (15 per cent) reporting that they were not managing well financially.
Households who don’t manage well
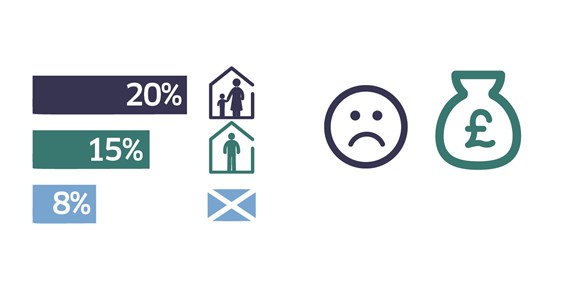
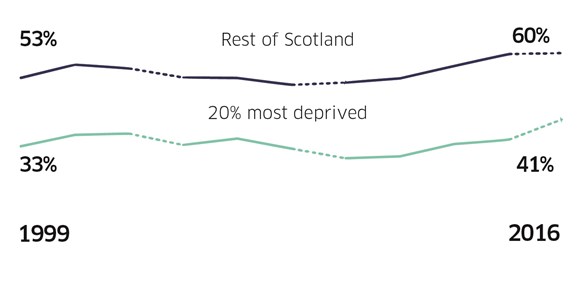
• The proportion of households in the 20 per cent most deprived areas who report they were managing well increased from 29 per cent in 2012 to 41 per cent in 2016.
• Consistently over the last 10 years it has been shown that those in the 20 per cent most deprived areas manage less well than those in the rest of Scotland. However this gap has narrowed since 2012 and was 20 per cent in 2016.
Households who manage well by deprivation
• Around two-thirds of owner occupiers reported managing well – more than double the proportion of households in social rented properties saying the same.
Internet

• Home internet access in Scotland is high and continuing to increase. 82 per cent of Scottish households reported having internet access at home in 2016, an increase of 2 percentage points from the prior year. Home internet access has increased over the past decade from 42 per cent in 2003.
• The vast majority of households with internet access at home reported having a broadband connection (98 per cent). Across all households (both households that have access to the internet and those who do not), 81 per cent had broadband at home.
• Home internet access varies with household income. In 2016, 63 per cent of households with incomes of £15,000 or less had home internet access, increasing to 98 per cent of households with incomes over £40,000.
• Eighty-four per cent of adults reported using the internet for personal or work use in 2016, while 16 per cent reported not using the internet at all.
• Gaps in internet access and use remain amongst certain groups including those in deprived areas, those in social housing and those on low incomes.
Sport
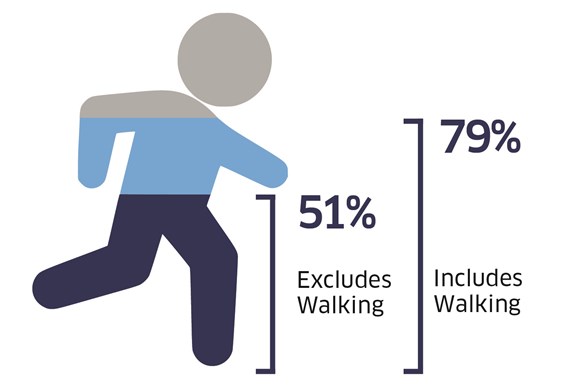
• In 2016 the vast majority of adults (79 per cent) had taken part in physical activity and sport in the previous four weeks.
• Participation in all physical activity and sport remained relatively constant between 2007 and 2010 (around 72 per cent). Recently people have become more active (rising to 75 per cent in 2011 and again to 79 per cent in 2016). The rise in physical activity is driven by the rise in recreational walking.
• Recreational walking (for at least 30 minutes) has consistently been the most common type of physical activity. Participation has risen from 57 per cent in 2011 to 67 per cent in 2016.
• Excluding walking, just over half (51 per cent) of the adult population participated in physical activity and sport in the four weeks prior to interview. This has remained broadly constant since 2007.
• Frequent participation (on more than 15 days in the past 4 weeks) was undertaken by just under half (48 per cent) of people. This was a slight drop from 50 per cent in 2015 but a pronounced improvement from the 36 per cent of 2007.
• Men are more active than women (81 per cent and 77 per cent respectively).
• Participation in physical activity and sport including walking declines with age.
Local services
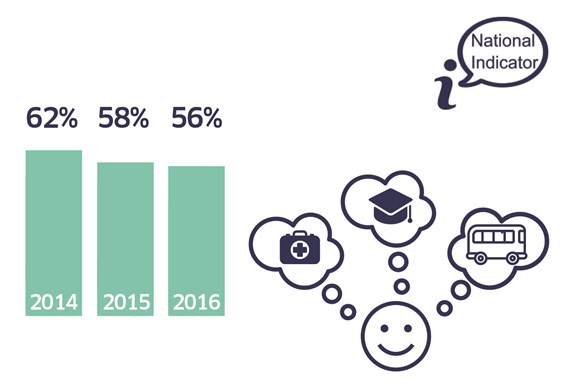
• In 2016, 56 per cent of adults were satisfied with all three of the following public services: local health services, schools and public transport (for which an opinion was given).
• Combined satisfaction with all three public services (local health services, schools and public transport) is at its lowest level since first measured in 2007, and down from a peak of 66 per cent in 2011.
• Looking at the services individually, adults tend to be most satisfied with local health services, followed by local schools and public transport. In 2016, 83 per cent of adults were satisfied with local health services, compared to 73 per cent who were satisfied with schools and 72 per cent with public transport. Satisfaction with schools has fallen over the last five years, from a high of 85 per cent in 2011 to the current level of 73 per cent, and this is the biggest factor in the corresponding trend in the combined indicator over this period.
• Satisfaction with the three public services among service users is generally higher than that of the whole adult population, and is more stable over time.
[1] This is a composite measure of the three services, and this composite indicator is the National Indicator on public service quality
http://www.gov.scot/About/Performance/scotPerforms/indicator/PSquality
The indicator is based on the percentage of adults who said that they were very or fairly satisfied with all three services, or for 1 or 2 services if they chose to express “no opinion” on the other service(s).
Environment
Climate change
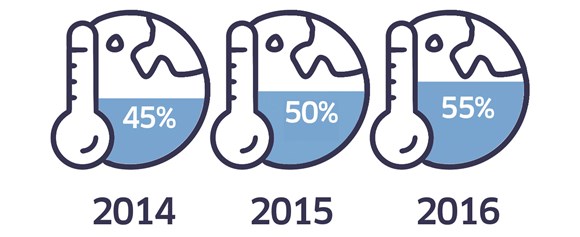
• Over half of adults (55 per cent) view climate change as an immediate and urgent problem, an increase of 5 percentage points compared with 2015 (50 per cent). Concern about climate change has increased in particular among the 16-24 age group, and is lowest among the 75+ age group.
Recycling
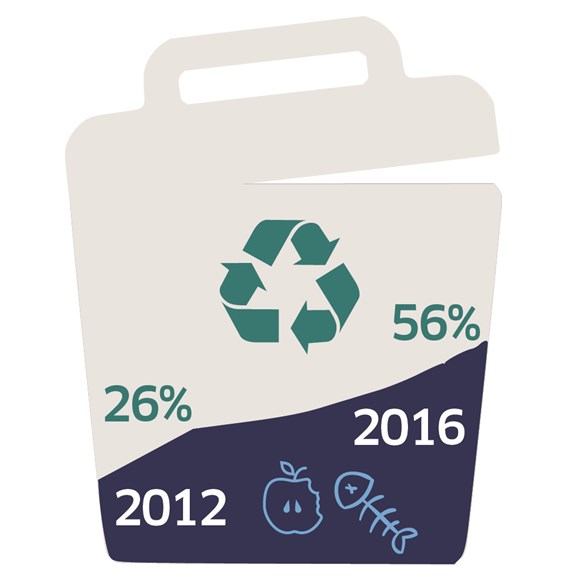
• More households are now disposing of their food waste in local authority-provided food caddies (56 per cent in 2016 compared with 26 per cent in 2012).
• Households in flats are much more likely to dispose of their food waste with their general waste as opposed to those living in houses (63 per cent compared to 39 per cent), while households in rural areas are more likely to use composting to dispose of their food waste than households in urban areas (20 per cent compared to 8 per cent).
Visits to the outdoors and greenspace
• Around half of adults (48 per cent) visited the outdoors at least once a week in the last year. This is around the same proportion as in 2015. Adults living in the most deprived areas were more likely not to have made any visits to the outdoors in the past twelve months (19 per cent) compared to those in the least deprived areas (7 per cent).
Volunteering
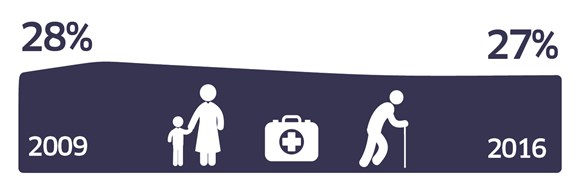
• Levels of volunteering have remained relatively stable over the last 5 years, with around three in ten adults providing unpaid help to organisations or groups. In 2016, 27 per cent of adults provided unpaid help to organisations or groups in the last 12 months.
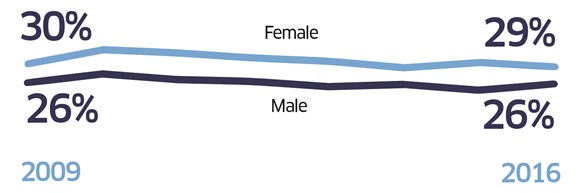
• The profile of volunteers has also remained relatively stable over time. Volunteers are more likely to be:
women
from higher socio-economic and income groups
from rural areas
from less deprived areas.
• Overall, the volunteering results from 2016 by economic situation, household income and area deprivation continue to support existing evidence about the under-representation of disadvantaged groups in volunteering.
Culture
• There are high and increasing levels of cultural participation in Scotland.
• Around nine in ten (92 per cent) adults were culturally engaged in 2016, either by attending or visiting a cultural event or place or by participating in a cultural activity. The level of cultural engagement has increased by around five percentage points since first recorded in 2007.
Cultural attendance
• Women, younger people, those with degrees or professional qualifications, those with good physical and mental health and those living in less deprived areas are more likely to attend cultural events.
• This profile has remained the same over time.
Cultural participation
• The most popular form of cultural participation was reading for pleasure.
The figures released today were produced by independent statistical staff free from any political interference, in accordance with professional standards set out in the Code of Practice for Official Statistics.
Background
1. The full statistical publication is available at: http://www.gov.scot/Publications/2017/09/9979
2. The SHS Key Findings 2016 is available at:
http://www.gov.scot/Publications/2017/09/6853
3. The SHS is a survey of households across the whole of Scotland, and is designed to provide reliable and up-to-date information on the composition, characteristics, attitudes and behaviour of Scottish households and individuals on a range of issues. It covers a wide range of key topics including household composition; housing; neighbourhoods and communities; economic activity; household finances; education; transport; internet and broadband; health and caring; local services; volunteering; culture and sport.
4. Further information on the Scottish Household Survey can be accessed at: http://www.gov.scot/SHS
5. Transport Scotland publishes the SHS transport and travel data directly. The Transport and Travel in Scotland (TATIS) annual publication, also published today, includes information on households' access to cars and bikes, frequency of driving, modes of travel to work and school (including an update to the National Indicator), use and opinions of public transport and access to services. From 2014 onwards, TATIS also includes the SHS Travel Diary, covering information about travel by adults, including journey purposes and the means of transport used amongst others: http://www.transportscotland.gov.uk/publications-stats
6. Whilst the SHS 2016 annual report does present some estimates related to economic activity, the official and most up-to-date source of statistics on employment, unemployment and economic activity is the Labour Force Survey for Scotland and the Annual Population Survey at a local authority level. Results from both surveys are available from the Scottish Government website: http://www.gov.scot/Topics/Statistics/Browse/Labour-Market
7. Housing Statistics for Scotland (published 12th September 2017) A full range of housing statistics is published annually. The latest of these contains data up to 31st March 2017. The Housing Statistics for Scotland 2017: Key Trends Summary contains an overview of the topics covered in the web tables. It provides a comprehensive summary of housing activity in Scotland: http://www.gov.scot/Topics/Statistics/Browse/Housing-Regeneration/HSfS
8. From 2012 onwards, the SHS was substantially redesigned and now includes elements of the Scottish House Condition Survey (SHCS) including a follow-up Physical Survey of dwellings. Results of this will be released later in 2017 through the SHCS Key Findings Report and will be available from the SHCS website: http://www.gov.scot/Topics/Statistics/SHCS
9. Official statistics are produced by professionally independent statistical staff – more information on the standards of official statistics in Scotland can be accessed at: http://www.gov.scot/Topics/Statistics/About
There is a problem
Thanks for your feedback