Acoustic deterrence using startle sounds: long term effectiveness and effects on odontocetes
This report presents the findings of field experiments aimed as testing the long-term effectiveness of a new deterrence method (acoustic startle reflex)on pinnipeds.
Startle threshold in bottlenose dolphins
Methods
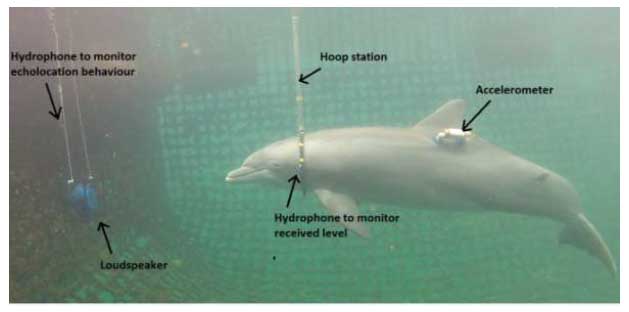
Experiments were carried out with trained captive bottlenose dolphins (Tursiops truncatus) at the Marine Mammal Research Facility of the Hawaii Institute of Marine Biology. The test subjects, a female (BJ) and a male (Boris), were trained to enter a hoop station which enabled them to remain stationary in front of a sound projector (Fig 10). A data logger which consisted of a three-dimensional acceleromter sensor ( GCDC X 6-2) was placed in a custom-made underwater housing and attached with suction cups latero-dorsally to the animal (Fig 10). The accelerometer sampled 320 data points per second and was used to quantify brief muscle flinches typically associated with the startle reflex. The tested sound stimuli were 50ms long 1/3 octave band noise pulses with centre frequencies of 1khz, 10kHz, 25 kHz and 32 kHz and an onset time of 1-2ms. The accelerometer tag was either positioned cranially (10kHz) or caudally (1kHz, 25 kHz and 32 kHz) of the dorsal fin. The sound projector consisted of either a Lubell loudspeaker 9162T (1 kHz & 10kHz) or an ITC 1032 hydrophone (25 kHz & 32 kHz) positioned 1.5m in front of the hoop station (Fig 10). The digital signals were played through a National Instruments card (controlled by LabView) onto a power amplifier which was connected to the respective sound transducer.
Fig 10: Experimental setup with one of the dolphins stationing in the hoop. Startle responses were quantified with the accelerometer tag attached to the animals.

In addition to the playback setup two montoring hydrophones were installed (B&K 8103, Reson TC 4103), one placed on the hoop station and one approximately 30 cm above the sound projector. The hydrophone located at the hoop station was used to monitor received levels in proximity to the dolphins' ear. The ouput of the two hydrophones was amplified with two Etec pre-amplifiers, digitized with a National Instruments card (sampling rates of 300kHz or 400 kHz) and recorded onto a second laptop computer.
An experimental trial started with the dolphin positioning at a touch pad in front of the trainer. The trainer gave the dolphin a signal to enter the hoop station while the behaviour of the animal was monitored with an underwater camera connected to an LCD screen. Once the animal had settled into the hoop station, a countdown to the start of the playback began. The time between start of the countdown and the playback was varied randomly across trials with intervals ranging from approximately 2s to 58s. The animal was then called back with an acoustic signal (trainer whistle), returned to the touch pad and received a food reward. Each experimental session consisted of 12 sound exposure trials and one no sound control during which exactly the same experimental procedure was followed but no playback was carried out. In each session the playback output was decreased in 6 dB steps from the first trial towards the 6 th trial, then increased by 3 dB and consecutively increased again in 6 dB steps up to the 12 th trial. Some playback sessions contained less trials due to malfunction of equipment.
Data analysis involved calculating received levels and time of playback from the calibrated acoustic record. Received levels measured at the hoop station were compensated for transmission loss between the hydrophone and the presumed acoustic window on the dolphin's head. Startle response magnitude was quantified by measuring peak to peak acceleration on all three axes of the accelerometer and calculating the overall vector acceleration (in Matlab R 2011). This was performed within a 1s time window after the onset of the sound pulse. The same procedure was carried out for the 'no sound control' trial in which case five 1s time windows were randomly selected when the animal was stationed without any sound playback. Startle thresholds were determined by two alternative methods. The first method involved fitting Generalized Linear Models with a gamma distribution of errors and a log-link function in R. The models included peak to peak acceleration (in m/s 2) as dependent variable, received level (in dB re 1 µPa) as independent variable, playback session as an ordered factor and playback number or log of playback number (within a session) as a covariate. The model with the lowest Akaike information criterion was used to predict the data. If playback number was included as a covariate then predicted values for an intermediate trial number were used ( i.e. trial 6.5). The startle threshold was determined in two different ways. In the first one, we used the model output received level that corresponded to the first predicted peak to peak acceleration value that was greater than the average acceleration found in the no sound control. The second method defined the threshold as the received level that caused an observed acceleration above the average acceleration measured during the no sound control.
Results
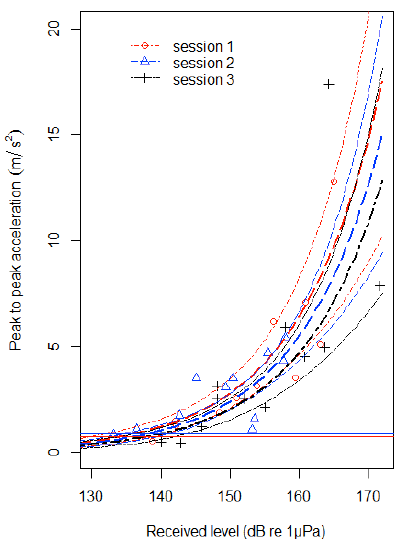
The data show that startle responses could be reliably elicited in the animals. Figure 11 shows the typical relationship between startle response magnitude i.e. the strength of the muscular flinch and received level. Startle response magnitude increased with increasing received level in a logarithmic fashion and did not seem to reach a ceiling within the tested range of received levels. The startle threshold in figure 11 corresponds to the point where the predicted curves cross the average peak to peak vector acceleration level during the respective no sound control trials. The modellling results revealed that received level was by far the most important predictor for startle magnitude while session number or playback number was much less important.
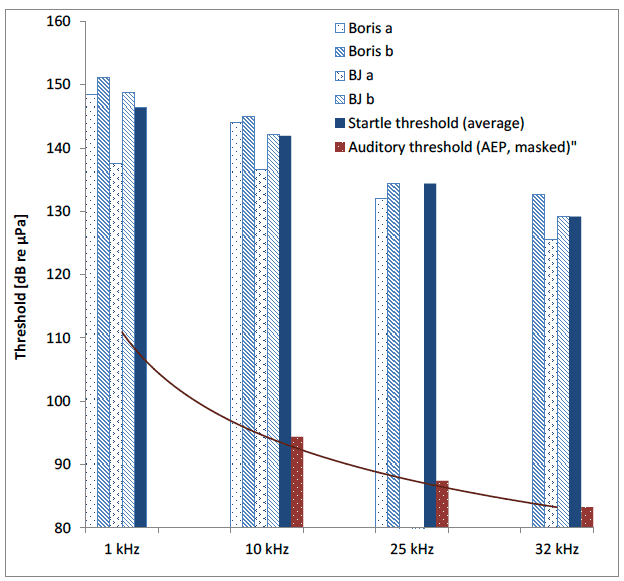
Average startle thresholds differed across the tested range of frequencies by approximately 20 dB (Fig 12). The lowest startle thresholds were measured in the ultrasonic range at a frequency of 32 kHz. The lowest average threshold at 32 kHz was found in BJ, the female dolphin. The average startle threshold increased by approximately 13 dB when frequencies were lowered from 32 kHz to 10 kHz. A further increase by another 5 dB can be found when comapring thresholds at 10 kHz and 1 kHz (Fig 12). The highest threshold of 151 µPa re 1µPa was found in the measured response at 1 kHz in the male dolphin. These differences roughly correlate with differences in the auditory sensitivity of the test subjects at the respective frequencies. Figure 12 shows the averaged hearing thresholds of the two dolphins at frequencies of 10 khz , 25 kHz and 32 kHz and the extrapolation of these data down to 1 kHz. The hearing threshold of these animals was measured electro-physiologically through auditory evoked potentials in a previous study. Startle thresholds followed the auditory threshold with a difference of 44-46 dB. We found considerable differences between the thresholds obtained by the two different methods. The method based on modelling the relationship between received level and startle magnitude consistently yielded lower levels than the observed startle data. This is due to the fact the fitted curves often had low slopes as they approached the 'no sound control' (Fig 11). Thresholds can therefore be viewed as the minimum received levels at which the reflex begins to cause a small muscle contraction.
Fig 11: Maximum peak to peak acceleration measured in the 1s time window after onset of the sound for all playback sessions using the 10 kHz noise pulse (female dolphin, BJ). The curves represent predicted values and confidence intervals obtained from the Generalised Linear Model. The horizontal lines give the average peak-to-peak acceleration levels during no sound controls for each playback session.

Fig 12: Startle thresholds obtained from the two test subjects at various frequencies. The dark blue column gives average values across the different methods and test subjects. Method a) refers to thresholds obtained from the models while method b) represents observed thresholds. The red bars represent an average of the electro-physiologically obtained hearing threshold for the two subjects. The solid line is a curve fitted to the hearing data in the red columns and was based on a power function.

Contact
There is a problem
Thanks for your feedback