Scottish farm business income: annual estimates 2015-2016
Farm business level estimates of average incomes for the accounting year 2015 to 2016, which relates to the 2015 crop year. For the most recent data, visit the Scottish farm business income (FBI) collection page below.
This document is part of a collection
3. Comparison of Profitability
3.1 Cost centres ( Table 7)
The purpose of cost centre analysis is to identify the contribution of different sources of income within the business to the overall business's profit or loss. Although referred to as 'cost centres' it is worth noting that these parts of the business are not just costs and they also generate income. All inputs and outputs have been counted against one of five cost centres: agricultural; agri-environment (land management to support environmental objectives); diversification; agricultural contracting (off-farm use of farm business resources); and income from the direct payments scheme (costs could be incurred against this centre if, for example, accountants are hired to manage claims).
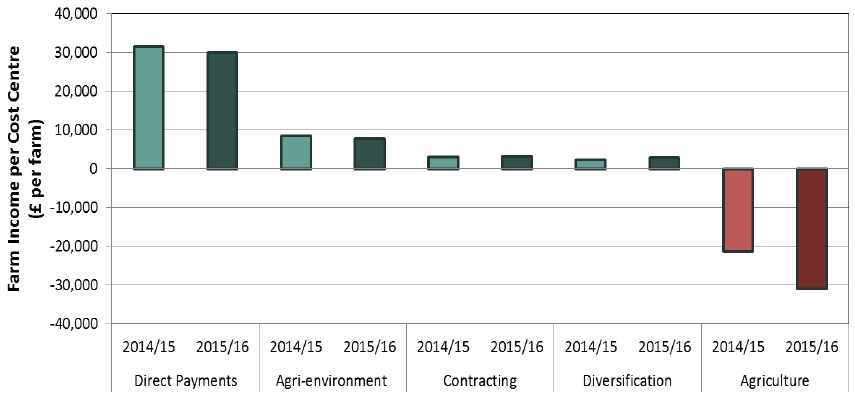
Figure 6 below shows the overall average income from each cost centre in 2014-15 and 2015-16. In both years, losses were accumulated against farming activity (the agricultural cost centre).
The average loss from agricultural farming activities increased in 2015-16 to £31,100. This loss from agricultural activities was offset by income from diversification, contracting and agri-environment activities. However, the profitability of the average Scottish farm business in the FBS is heavily reliant on income from the Direct Payment Schemes.
Figure 6: Farm Business Income by cost centre

The average income to Scottish farm businesses in the survey from direct payments was £30,000 in 2015-16, a decrease of five per cent on the previous year. There was an eight per cent decrease in the value derived from agri-environment schemes to an average of £7,800. Contracting increased two per cent in the latest year, with this activity generating an average of £3,100. Diversified activities generated £2,800 on average, a 19 per cent increase since 2014-15. Despite the low average income from diversified activities, farms engaged in such activities reported notably higher incomes than non-diversified farms on average.
3.2 Diversified activities ( Tables 8, 9)
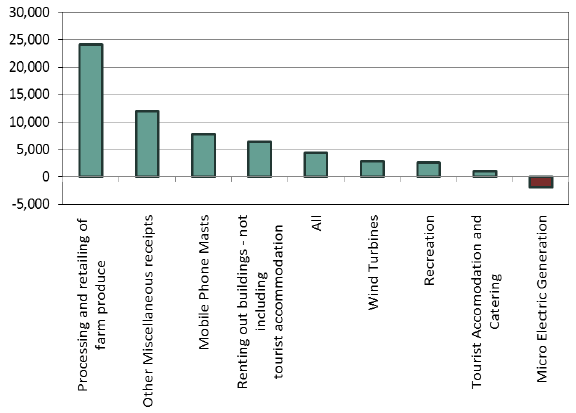
Some farms receive additional income from diversified activities and figure 7 shows the main activities undertaken and the average income from each in 2015-16. Of farms engaged in diversified activities, the overall average income from such activities was £4,400. The most common diversified activity was renting out buildings for uses other than tourist accommodation which accounted for 46 per cent of activities. Processing and retailing of farm produce was the activity that generated the greatest income, with an average income of £24,200.
Figure 7: Average income from diversified activities in 2015-16

The largest increase in number of activities in the sample was seen in micro electric generation, which includes renewable energy other than wind turbines ( e.g. solar panels, biomass boilers and hydro-electric). However, micro electric generation was the only activity to make a loss, with the average loss of income being £1,900. Losses in this category have reduced since 2014-15 due to a fall in start-up costs as well as depreciation costs.
The unmatched sample shows that average income from diversified activities had increased by 32 per cent in the last year. The only two types of diversified activity which had a decrease in income from 2014-15 were renting out buildings for uses other than tourist accommodation and mobile phone masts, which decreased by one per cent and ten per cent respectively.
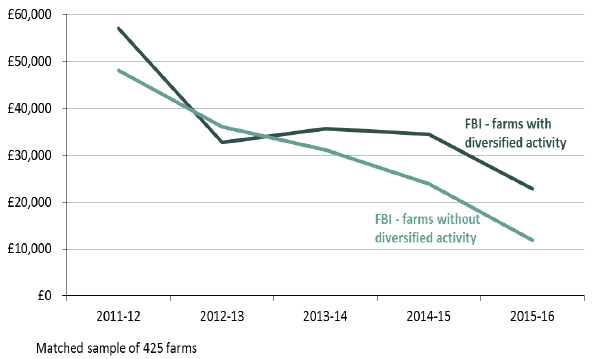
Figure 8 shows, from a five year matched sample (comparing the same farms each year), the average FBI of those farms engaged in any diversified activity and those with no diversified activities. Diversification is assessed over, at most, a five-year period to allow for a reasonable matched sample size. Note that the matched sample is un-weighted and therefore describes sample averages only.
Figure 8: Comparison of average income of farms with and without diversified activities

The average difference in FBI between diversified and non-diversified farms was around £11,000. Average FBI for farms engaged in diversified activities was £22,800, which was 34 per cent lower than the previous year, while the average income on non-diversified farms has fallen by 51 per cent to £11,800.
From farms engaged in diversified activity in the matched sample, the average income from the diversified activities in 2015-16 was £6,700, a 33 per cent increase from the previous year.
Contact
Email: agric.stats@gov.scot
Phone: 0300 244 4000 – Central Enquiry Unit
The Scottish Government
St Andrew's House
Regent Road
Edinburgh
EH1 3DG
There is a problem
Thanks for your feedback