Behaviour in Scottish schools: 2016 research
This report is from the fourth (2016) wave of behaviour in Scottish schools research, first undertaken in 2006.
5 Changes over time
5.1 This section looks first at changes between 2012 and 2016 in relation to a long list of specific postive behaviours, low-level disruptive behaviours and serious disruptive behaviours. It then describes the longer term changes over time (since the first wave of the survey in 2006) for some key measures.
Key findings
5.2 The biggest change relates to low-level disruptive behaviour in the primary classroom ( e.g. hindering other pupils, work avoidance and making unnecessary noise). This increased between 2012 and 2016.
5.3 Primary staff were asked what they thought the reaons for this increase might be. They suggested reasons relating to societal changes (including the increased use of digital technologies), their perceived approaches to parenting, and a reduction in the availability of ASN resources (support staff, on- and off-site provision, and expert advice).
5.4 Overall, there has been little change in low-level disruptive behaviour in secondary schools.
5.5 Overall, looking at the whole range of behaviours in this category, there has been little change in serious disruptive behaviour in either primary or secondary schools. However, primary support staff have experienced slightly higher levels of general verbal abuse, physical aggression and physical violence towards them personally. The increase in experiences of these three behaviours occurred between 2012 and 2016.
Changes in behaviours between 2012 and 2016
5.6 Table A1 in Annex A shows where there have been changes between 2012 and 2016 in the proportion of staff reporting experience of specific behaviours. Figure 5.1 below provides a high-level summary.
Figure 5.1 Summary of changes between 2012 and 2016

The overall picture in primary schools
5.7 There were very few changes in relation to positive behaviours between 2012 and 2016: support staff, teachers and headteachers continue to report that pupils were exhibiting positive behaviours most of the time.
5.8 There was also little change, overall, in relation to serious disruptive behaviours. There were very few changes in the levels reported by teachers and headteachers. However, there is evidence of a slight increase in general verbal abuse, physical aggression and physical violence towards support staff: while there was no statistically significant difference in the levels they reported over the previous week, there was an increase in the number reporting one or more incidents over the previous 12 months.
5.9 The biggest changes relate to low-level disruptive behaviour in the classroom ( e.g. hindering other pupils, work avoidance and making unnecessary noise). Support staff and teachers [7] reported having to deal with all these behaviours more frequently than had been the case in 2012. Teachers also encountered slightly more low-level disruption around the school – although there was no difference in the levels reported by headteachers [8] .
5.10 The potential reasons for this increase in low-level disruptive behaviour were explored in the qualitative research with primary school staff and are discussed in paragraphs 5.27 to 5.47 below.
The overall picture in secondary schools
5.11 Overall, there was relatively little change in behaviour in secondary schools between 2012 and 2016. A table showing changes in individual behaviours can be found in Annex A.
5.12 In relation to some of the positive behaviours in the classroom ( e.g. pupils contributing to class discussions and enthusiastically participating in classroom activities), there was a slight decrease in the levels reported by teachers. However, there was little change in the experiences of support staff or headteachers. There was also little difference in relation to positive behaviours around the school.
5.13 There were very few differences in relation to serious disruptive behaviour.
5.14 Teachers indicated that they had to deal with the low-level disruptive behaviours in the classroom somewhat more frequently than in 2012. However, there was no change in the experience of support staff. Teachers also reported slightly higher levels of some low-level disruptive behaviours around the school but headteachers did not.
Longer term trends over time
5.15 Figures 5.2 to 5.11 below show the trends for some key measures since the first Behaviour in Scottish Schools survey in 2006. Personal experience of serious disruptive behaviour over the past 12 months was first asked about in the 2009 survey and Figures 5.12 to 5.14 show the trends since then. 'No change' indicates that there was no statistically significant change in the measure. [9]
Longer term trends in positive behaviour
5.16 There has been a decrease since 2012 in the proportion of primary support staff and teachers who think that all or most pupils are generally well behaved during lessons ( Figure 5.2). This is in line with the finding that they are encountering more low-level disruptive behaviour in the classroom (discussed at 5.9 above). However, there has been no change over time in the proportions of primary staff who find that all or most pupils are generally well behaved around the school ( Figure 5.4).
5.17 Although there was no change in their experience of specific behaviours, there has been a slight decrease since 2012 in the number of secondary support staff who feel that all or most pupils are generally well behaved during lessons ( Figure 5.3), with levels now similar to 2006. In contrast, the proportion of secondary teachers who feel that pupils are generally well behaved during lessons has increased slightly since 2006.
5.18 Secondary support staff and teachers' perceptions of pupil behaviour around the school have improved somewhat since 2006. The perceptions of secondary headteachers were already extremely positive and have remained so ( Figure 5.5).
Figure 5.2: Proportion of staff reporting that all or most pupils are generally well behaved during lessons (primary)
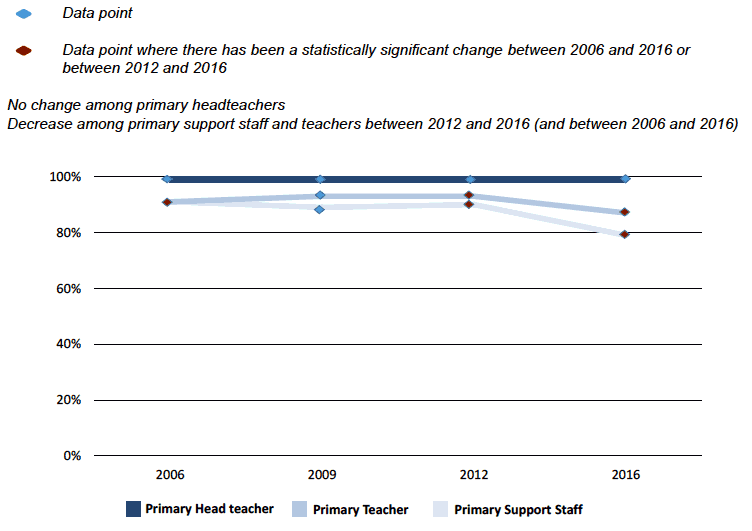
Bases: primary headteachers 295 (2016), 304 (2012), 244 (2009), 215 (2006): primary teachers 707 (2016), 879 (2012), 547 (2009), 529 (2006): primary support staff 472 (2016), 588 (2012), 382 (2009), 187 (2006)
Figure 5.3: Proportion of staff reporting that all or most pupils are generally well behaved during lessons (secondary)
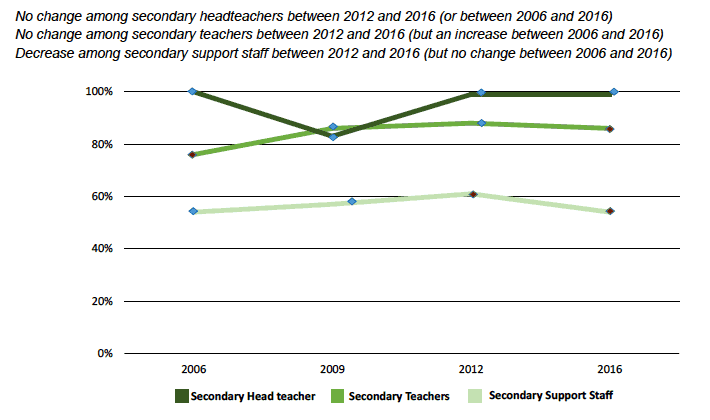
Bases: secondary headteachers 193 (2016), 266 (2012), 246 (2009), 169 (2006): secondary teachers 1795 (2016), 1994 (2012), 1460 (2009), 547 (2006): secondary support staff 658 (2016), 774 (2012), 657 (2009), 312 (2006)
Figure 5.4: Proportion of staff reporting that all or most pupils are generally well behaved around the school (primary)
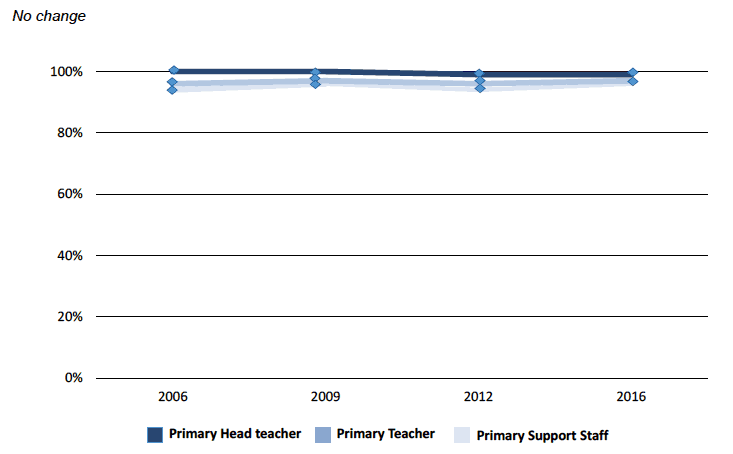
Bases: primary headteachers 295 (2016), 304 (2012), 244 (2009), 215 (2006): primary teachers 704 (2016), 884 (2012), 556 (2009), 529 (2006): primary support staff 476 (2016), 589 (2012), 382 (2009), 187 (2006)
Figure 5.5: Proportion of staff reporting that all or most pupils are generally well behaved around the school (secondary)
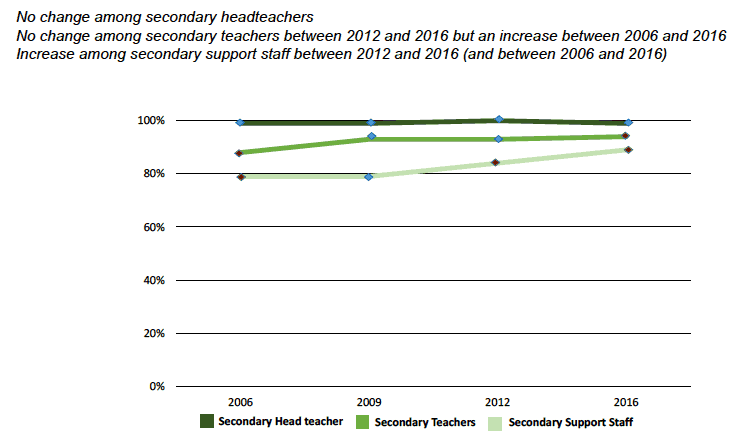
Bases: secondary headteachers 193 (2016), 266 (2012), 246 (2009), 169 (2006): secondary teachers 1776 (2016), 2017 (2012), 1460 (2009), 547 (2006): secondary support staff 656 (2016), 784 (2012), 678 (2009), 312 (2006)
Longer term trends in low-level disruptive behaviour
5.19 Figures 5.6 to 5.9 show the trends for some of the most common low-level disruptive behaviours and those which support staff and teachers have consistently identified – in 2016 as they did in 2006 – as the behaviours which have the most impact on their experience: talking out of turn; hindering other pupils and work avoidance.
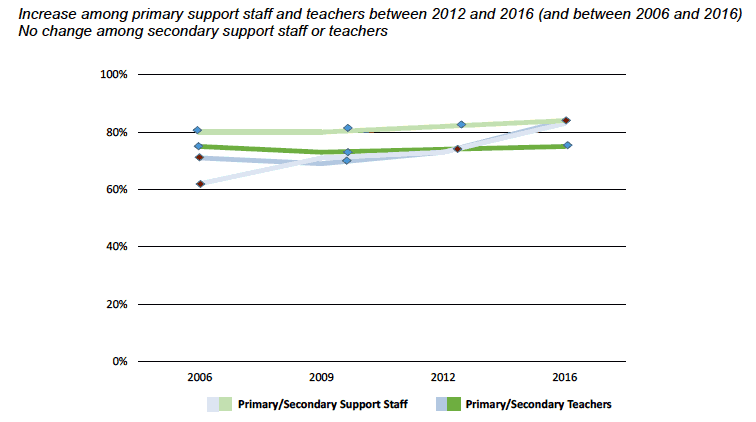
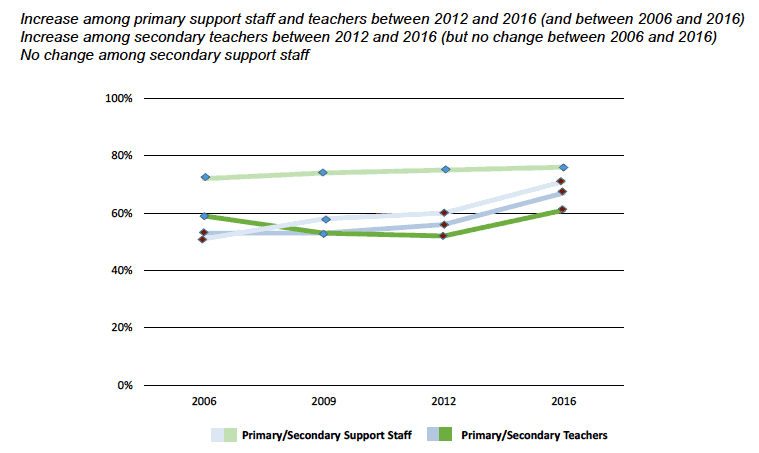
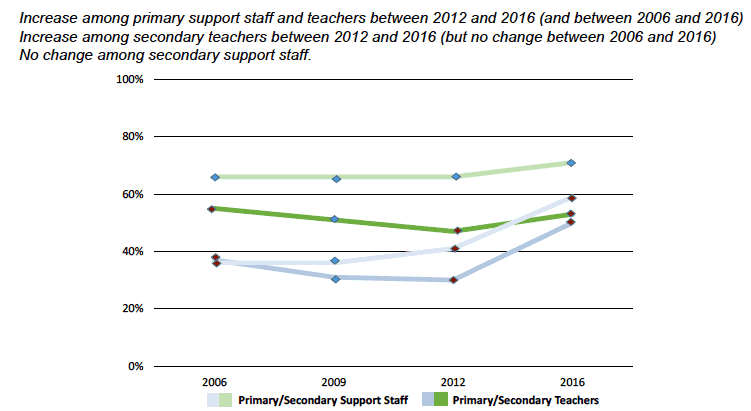
5.20 Since 2006, primary support staff and teachers have encountered all three behaviours more often. For teachers, most of the change occurred between 2012 and 2016. For support staff, there has beeen a steadier increase over time ( Figures 5.6 to 5.8).
5.21 There has been less change over time in secondary schools. Among support staff, there have been no changes since 2006 in their experiences of these behaviours. Among teachers, there have been no changes in relation to talking out of turn. The proportion of secondary teachers having to deal with pupils hindering other pupils and work avoidance had dropped between 2006 and 2012, but it has increased again and the levels are now back to what they were in 2006 ( Figures 5.6 to 5.8).
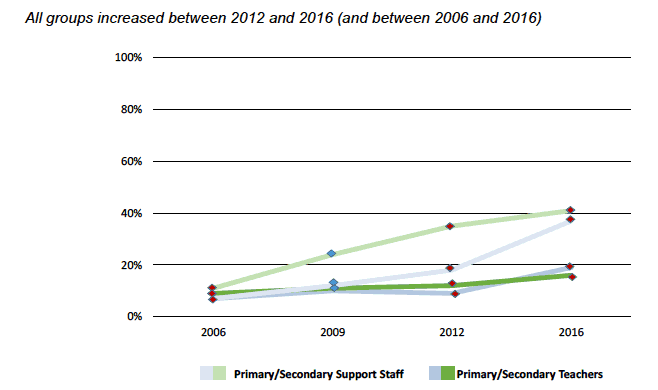
5.22 One key measure of disengagement is 'pupils withdrawing from interaction with others/you'. As Figure 5.9 shows, reported levels have increased since 2006 (in both primary and secondary and for both support staff and teachers). The potential reasons for this were explored in the qualitative research with staff and are discussed in paragraphs 5.48 to 5.55 below.
Figure 5.6: Proportion of staff reporting that they had to deal with 'talking out of turn ( e.g. by making remarks, calling out, distracting others by chattering)' once a day or more in the previous week
Bases: secondary teachers 1786 (2016), 2014 (2012), 1460 (2009), 547 (2006): primary teachers 706 (2016), 890 (2012), 556 (2009), 529 (2006): secondary support staff 650 (2016), 781 (2012), 657 (2009), 312 (2006): primary support staff 465 (2016), 585 (2012), 382 (2009), 187 (2006)
Figure 5.7: Proportion of staff reporting that they had to deal with 'hindering other pupils ( e.g. by distracting them from work, interfering with materials)' once a day or more in the previous week
Bases: secondary teachers 1786 (2016), 2014 (2012), 1460 (2009), 547 (2006): primary teachers 706 (2016), 890 (2012), 556 (2009), 529 (2006): secondary support staff 650 (2016), 781 (2012), 657 (2009), 312 (2006): primary support staff 465 (2016), 585 (2012), 382 (2009), 187 (2006)
Figure 5.8: Proportion of staff reporting that they had to deal with 'work avoidance ( e.g. by delaying start to work set)' once a day or more in the previous week
Bases: secondary teachers 1786 (2016), 2014 (2012), 1460 (2009), 547 (2006): primary teachers 706 (2016), 890 (2012), 556 (2009), 529 (2006): secondary support staff 650 (2016), 781 (2012), 657 (2009), 312 (2006): primary support staff 465 (2016), 585 (2012), 382 (2009), 187 (2006)
Figure 5.9: Proportion of staff reporting that they had to deal with 'pupils withdrawing from interaction with others/you' once a day or more in the previous week
Bases: secondary teachers 1780 (2016), 2007 (2012), 1448 (2009), 541 (2006): primary teachers 703 (2016), 884 (2012), 552 (2009), 524 (2006): secondary support staff 642 (2016), 785 (2012), 639 (2009), 308 (2006): primary support staff 468 (2016), 581 (2012), 375 (2009), 185 (2006)
Longer term trends in serious disruptive behaviour
5.23 In primary schools, there has been no change since 2006 in the proportion of staff having to deal with physical aggression or violence by pupils towards other pupils ( Figures 5.10 and 5.11).
5.24 In secondary schools, there has been a decrease since 2006 in the proportion of support staff encountering physical aggression by pupils towards other pupils and a decrease in the proportion of teachers encountering physical violence by pupils towards other pupils ( Figures 5.10 and 5.11).
5.25 However, there has been an increase in primary support staff and teachers' experiences of physical aggression towards them personally and support staff (though not teachers) also experienced an increase in physical violence and general verbal abuse towards them personally. The increases occurred between 2012 and 2016. There has been no change in primary headteachers' experiences ( Figures 5.12 to 5.14).
5.26 There was very little change in secondary staff experiences of physical violence, aggression or verbal abuse towards them personally. The only change was that secondary support staff experienced more incidents of general verbal abuse towards them personally than they did in 2006 – with the increase occuring between 2012 and 2016 ( Figures 5.12 to 5.14).
Figure 5.10: Proportion of staff reporting that they had to deal with 'physical aggression towards other pupils ( e.g. by pushing, squaring up)' in the classroom once a day or more in the previous week
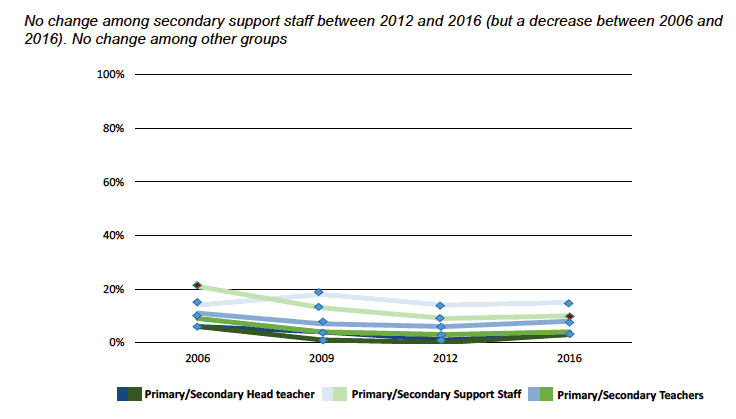
Bases: secondary headteachers 186 (2016), 266 (2012), 242 (2009), 162 (2006): primary headteachers 291 (2016), 303 (2012), 242 (2009), 205 (2006): secondary teachers 1779 (2016), 2019 (2012), 1456 (2009), 547 (2006): primary teachers 705 (2016), 885 (2012), 554 (2009), 525 (2006): secondary support staff 650 (2016), 782 (2012), 653 (2009), 309 (2006): primary support staff 471 (2016), 583 (2012), 381 (2009), 185 (2006)
Figure 5.11: Proportion of staff reporting that they had to deal with 'physical violence towards other pupils ( e.g. punching, kicking, head butting, use of a weapon)' in the classroom once a day or more in the previous week
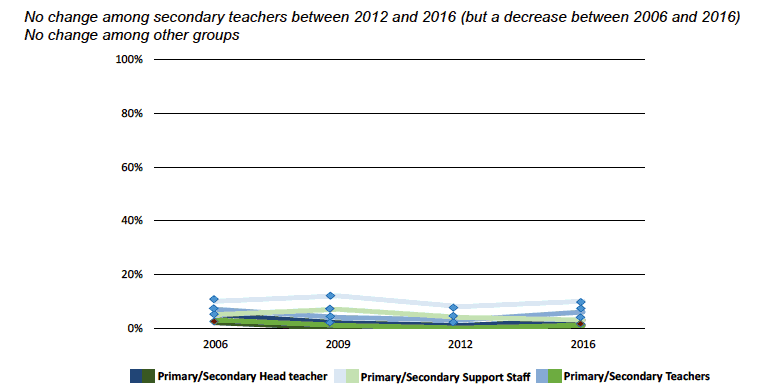
Bases: secondary headteachers 186 (2016), 266 (2012), 242 (2009), 162 (2006): primary headteachers 291 (2016), 303 (2012), 242 (2009), 205 (2006): secondary teachers 1779 (2016), 2019 (2012), 1456 (2009), 547 (2006): primary teachers 705 (2016), 885 (2012), 554 (2009), 525 (2006): secondary support staff 650 (2016), 782 (2012), 653 (2009), 309 (2006): primary support staff 471 (2016), 583 (2012), 381 (2009), 185 (2006)
Figure 5.12: Proportion of staff reporting that they personally experienced at least one incidence of 'general verbal abuse towards you ( e.g. threatening remarks)' in the previous 12 months
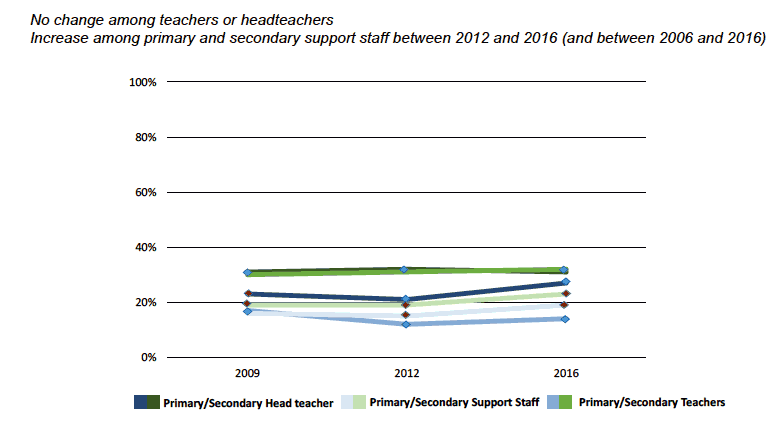
Bases: secondary headteachers 185 (2016), 266 (2012), 246 (2009): primary headteachers 289 (2016), 307 (2012), 243 (2009): secondary teachers 1643 (2016), 2044 (2012), 1462 (2009): primary teachers 692 (2016), 894 (2012), 559 (2009): secondary support staff 600 (2016), 795 (2012), 678 (2009): primary support staff 400 (2016), 599 (2012), 389 (2009)
Figure 5.13: Proportion of staff reporting that they personally experienced at least one incidence of 'physical aggression towards you ( e.g. pushing, squaring up)' in the previous 12 months
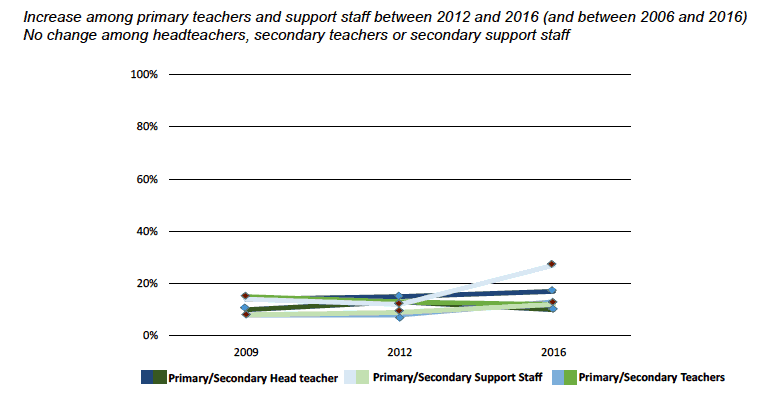
Bases: secondary headteachers 185 (2016), 266 (2012), 246 (2009): primary headteachers 289 (2016), 307 (2012), 243 (2009): secondary teachers 1643 (2016), 2044 (2012), 1462 (2009): primary teachers 692 (2016), 894 (2012), 559 (2009): secondary support staff 600 (2016), 795 (2012), 678 (2009): primary support staff 400 (2016), 599 (2012), 389 (2009)
Figure 5.14: Proportion of staff reporting that they personally experienced at least one incidence of 'physical violence towards you ( e.g. punching, kicking, head butting, use of a weapon)' in the previous 12 months
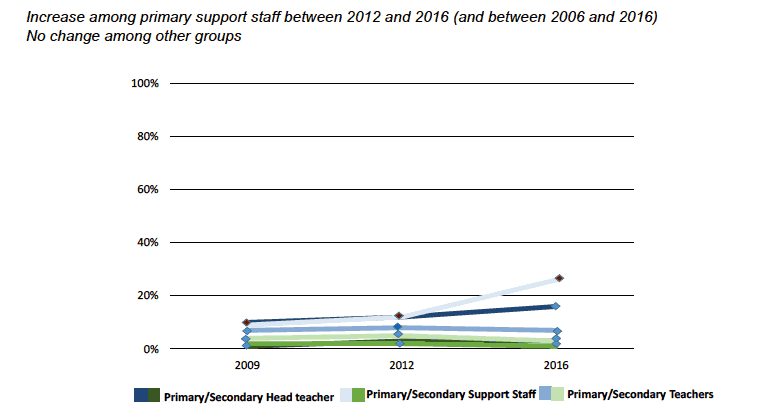
Bases: secondary headteachers 185 (2016), 266 (2012), 246 (2009): primary headteachers 289 (2016), 307 (2012), 243 (2009): secondary teachers 1643 (2016), 2044 (2012), 1462 (2009): primary teachers 692 (2016), 894 (2012), 559 (2009): secondary support staff 600 (2016), 795 (2012), 678 (2009): primary support staff 400 (2016), 599 (2012), 389 (2009)
Why has low-level disruption in primary schools increased?
5.27 The remainder of this section is based on findings from the qualitative research [10] . The quantitative survey found that both primary teachers and primary support staff reported dealing with low-level disruption in the classroom more frequently in 2016 than they had in 2012. We explained this finding and explored their perceptions of the possible reasons for it in the qualitative research with primary headteachers, teachers and support staff. Low-level disruption was also discussed with secondary staff.
5.28 The reasons suggested by staff for the increase in low-level disruption in primary schools were varied and often intertwined. However, there were two underlying themes at the core of many of the issues that were raised: increasing use of digital technology and perceived changes in the parent-child relationship. There was a further theme related to insufficient ASN resources and staffing that was more clearly separated from the other two raised (although there are areas of overlap here too). It is worth noting that, apart from ASN resources, staff focused on external factors rather than school factors – so it may be worthwhile considering how schools can work alongside, and influence, these social and cultural factors. Their views on a range of school factors are explored in subsequent chapters.
5.29 There were six main reasons suggested for the increase in low-level disruptive behaviour:
- lower levels of respect for adults and, in particular, teachers than in the past
- less well developed social skills
- lower levels of resilience, both in terms of pupils' relationships with other pupils, and in response to challenging learning situations
- lower levels of concentration and shortened attention spans
- a greater number of pupils exhibiting a need for attention
- a greater number of pupils exhibiting a need for attention a reduction in the availability of ASN resources (support staff, on- and off-site provision, and expert advice).
Respect
5.30 Teaching and support staff thought that the level of respect pupils held for others (including teachers) had diminished over time. There were two main ways this was demonstrated. The first, most commonly raised by support staff, was a general deterioration in manners. The second was the display of what teachers termed a 'defiant' attitude shown through constant questioning of instructions and refusal to carry out tasks.
5.31 There was no single explanation provided for why respect had decreased and it was seen as a wider societal issue. More specifically, one common explanation from staff was that inappropriate language and disrespectful treatment of others on social media has increased, and this type of behaviour has therefore been normalised in society. It was suggested that young people's exposure to this means they are less able to determine the correct way to interact with others.
5.32 Another explanation given by staff was that this lack of respect was due to some parents not modelling respectful behaviour for their children [11] . Both teaching and support staff felt that some parents would assume that an incident has happened as a result of something the school has done rather than their child. This was linked to a wider societal 'blame culture'.
Reduced social skills
5.33 One explanation given for the increase in low-level disruption was a perception that pupils' social skills are less well developed than they once were. Teachers thought that, with poorer social skills, pupils were more likely to argue with their peers, say inappropriate or hurtful things, and to respond in a disproportionate manner so that these incidents escalate.
5.34 Staff thought that pupils face greater social isolation than in the past because they spend more time alone and unsupervised (often using digital technology) rather than spending time face-to-face with friends or family. This means that they do not have the opportunity to develop the type of social skills needed to effectively interact with their peers and with adults.
Resilience
5.35 It was common for staff at all levels, including headteachers, to discuss a perceived lack of resilience as a major change in pupils' skills set over recent years, both in terms of their interactions with their peers and when facing challenges, either in their personal life or in their school work.
5.36 An explanation provided for this perceived decrease in levels of resilience was a view that some parents are increasingly solving their children's problems without first encouraging them to tackle problems themselves. This may mean that these children are becoming less independent, are not developing problem solving skills, or patience, and may not know how to act appropriately if faced with difficulty. The expectation that an adult will step in if they find something difficult can then carry over into school life.
5.37 An alternative explanation, specifically related to resilience in peer relationships, was related to a perception that pupils were more socially isolated. In addition to causing low-level disruption through less well developed social skills (as discussed above), it was felt that pupils did not have the opportunity to build up resilience in dealing with difficult interpersonal situations.
5.38 It was thought that were several consequences to this. Firstly, that pupils were more reliant on staff members to resolve problems between peers which may have been previously resolved between themselves. Secondly, it was felt that pupils were less able to cope with challenges they faced in their personal lives and this was manifested through 'acting out' in class. Thirdly, teachers (in particular) felt that if pupils came up against a piece of work that they found challenging they were more likely to 'give up' and expect a teacher to solve the problem for them, or to disengage, rather than try again.
I think they expect you to deal with everything, things…are minor little fall outs…, they want you to do something about it. Like, 'go and tell them they have to play with me'.
Primary support staff
Concentration and attention span
5.39 Teachers in both primary and secondary schools felt that pupils struggled to concentrate more now than they had in the past and that their attention spans were shorter.
5.40 If a pupil was not concentrating, or lost interest in the task set by the teacher, this led to disengagement. In turn, disengagement led to pupils being more likely to distract others.
5.41 The predominant view was that digital technology could be the cause of poor concentration levels and short attention spans, and its effects were thought to be twofold. Firstly, teachers and support staff believed that pupils were getting less sleep than they had previously (because they were playing computer games and spending more time on social media late at night). Secondly, digital technology allows pupils to near constant access to entertainment. Teachers felt that it was therefore more difficult to keep them engaged in school work – lessons had to incorporate greater variety to be successful.
Need for attention
5.42 Primary school staff felt that more pupils were exhibiting a need for attention. This encompassed several behaviours, including constantly seeking affirmation from the teacher, wanting to be close to the teacher at all times and shouting out in class out of turn.
Low-level behaviour sort of suggests that they're doing naughty things for [the sake of it], I don't think the children are doing that. They are desperately, desperately seeking attention at lots and lots of different levels. I think it's the shouting out, it's the coming up, it's the close proximity, it's the need to feel safer, closer to an adult in a way.
Primary teacher
5.43 While both teachers and support staff spoke of increased need for attention among pupils, primary teachers made an explicit link between these types of behaviours and an increase in pupils with attachment type disorders.
5.44 The perceived increase in the need for attention was thought to be due to some families spending less time together. However, even if families are physically together, the increase in digital media use means that they are not necessarily interacting. As noted above, staff believed that some pupils were being given less attention, with some parents using tablets or smartphones as a 'babysitter'.
Changes to ASN resources
5.45 School staff frequently raised ASN resources when discussing increases in low-level disruption, particularly in relation to reductions in local authority special school provision and the number of support staff available to the school.
5.46 The number of pupils identified with ASN in mainstream schools has risen since 2012, although to a greater extent in secondary schools than primary schools [12] . While school staff, on the whole, supported the inclusion principles behind some of this rise [13] , they felt that the provision of ASN support was not proportionate to the additional work that this required of schools.
5.47 Furthermore, it was common for teachers and headteachers to say they had seen a reduction in the number of support staff at the school, in combination with reduced levels of support for pupils with ASN at a local authority level – both in terms of on-site and off-site provision and expert advice (including educational psychology input). The link between resourcing (more broadly) and disruptive behaviour is discussed further in paragraph 10.40.
Why has disengagement increased?
5.48 As Figure 5.9 above shows, levels of disengagement (as measured by the statement 'pupils withdrawing from interaction with others/you') increased between 2006 and 2016. This was the case for teachers and support staff, in both sectors.
5.49 This was explored further in the qualitative research. It is important to note that staff tended to discuss it mostly in relation to immediate engagement/disengagement with teaching and learning in the classroom, and not with school life in a broader sense.
5.50 Disengagement was often seen as a precursor to low-level disruptive behaviour and some of the explanations for an increase were the same as those for the increase in low-level disruptive behaviour: poorer levels of concentration and lower levels of resilience when dealing with challenges. (See paragraphs 5.35 to 5.41 above.)
5.51 In addition to these reasons, there was a view among some secondary teachers and headteachers that the introduction of the new National qualifications had led to increased disengagement of some S4 pupils. They were concerned that the lack of an exam for National 4 qualifications demotivated pupils completing this level. The lack of an exam was felt to devalue the award which had an impact on pupils' self-esteem – and this was exacerbated by schools forming mixed level classes (pupils completing National 4 and 5 (which does involve an exam) in the same class).
5.52 Another consequence that secondary teachers and headteachers highlighted was that parents were often keen to have their child complete National 5, even if the school recommends they should be completing National 4 – again this was related to parental doubts about the value of a qualification without a final exam. This meant that some pupils were forced to work at a level that was not appropriate for their abilities and other qualification pathways were not considered.
5.53 Introduced as part of CfE, the broad curriculum has been extended from S1-2 to S3. Secondary teachers commented on two possible ways this could encourage disengagement. Firstly, they had previously found that the move into S3 signalled a time when pupils become more focused as they started studying for qualifications. However, now that the broad curriculum has been extended, teachers felt that pupils were unfocused for longer. Teachers thought that this was a particular problem in subjects that pupils knew they were not going to continue.
What works well in tacking disengagement?
5.54 What works in relation to engaging pupils in their learning is discussed in Chapter 7.
5.55 In addition, headteachers in particular, highlighted the need to be flexible and that often the best way to engage certain pupils was to offer an alternative to classroom-based learning. This was commonly through college courses and work experience programmes but did cover a range of other opportunities. For example, in one school some S4 pupils were given the opportunity to work in a local bicycle shop as an alternative to some classes. Another school had an outdoor classroom at a local business and involved pupils in helping with PE classes.
Contact
There is a problem
Thanks for your feedback