Climate Change Plan: third report on proposals and policies 2018-2032 – technical annex
This annex provides an overview of the analysis underpinning the Climate Change Plan
Resources
Overview
This encompasses all domestically produced and imported/exported primary resources.
The energy resources are available to the model directly, through processing technologies, or through infrastructure networks. The model aims to find the cost optimal mix of import, export and domestic creation of primary and secondary energy forms to meet the energy service demands.
Primary resources are broadly broken down into:
- Fossil fuels
- Biomass and Waste
- Nuclear
- Renewables
Data Inputs and additional constraints since the Draft Plan:
Primary energy supply data from the Scottish Government's Energy Balance provides the resource base year availability data for fossil fuels, nuclear and renewables that feed into TIMES. Biomass potential availability assumptions have been updated since the draft Plan. They were sourced from a study commissioned by BEIS from Ricardo, the latest emissions and land-use projections from the Centre for Ecology and Hydrology ( CEH), the Forestry Commission ( FC) and DEFRA. They represent a reduction in the amount of biomass available across the system relative to availability in the draft plan. Waste availability assumptions have also been updated as outlined in the Waste section above.
Results:
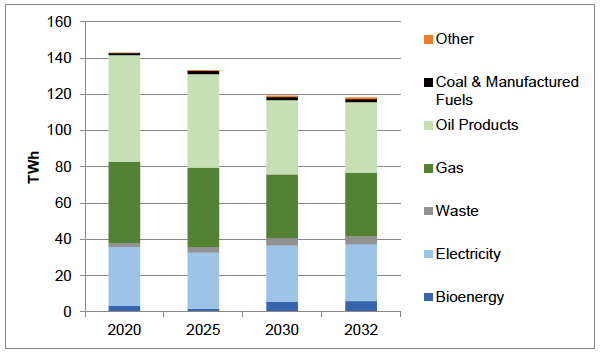
The figure below shows the proportion of each fuel consumed by the system between 2020 and 2032. These represent final energy consumption, and as a result do not include energy fuels used to manufacture intermediate fuels such hydrogen, and electricity. The share of low-carbon fuel inputs (including electricity) increases by around 10 percentage points, reaching approximately 35% in 2032 [12] . This is driven by increases in the share of both bioenergy (including waste) and renewable electricity, while the share of oil products and natural gas falls by 8 and 1.5 percentage point respectively, over the period.
This switch in fuels takes place in the context of falling energy used, as a result of improved system efficiency and conservation measures, which see overall energy used fall by around 17% between 2020 and 2032.
Figure 20: Fuel Use in the Scottish system ( TWh), TIMES model results

Contact
There is a problem
Thanks for your feedback