Scottish household survey 2017: consultation responses analysis
An analysis of responses to the Scottish Household Survey 2017 and beyond consultation.
3. VIEWS ON OPTIONS FOR 2017
Preferences for Options A and B
Questions four and five asked 'what would be the impact of option A and B, respectively, on their organisations' use of the SHS. This was followed by question 6(i) which asked people to state their option preference, and to explain the reason for their option preference in 6(ii). When reviewing the responses it became evident that the most useful way of reporting on these questions was to report on 6(i) and (ii) first, before reporting on the impact of the two different options.
93 out of 99 respondents (94 per cent) answered questions 4 and 5, whilst the same number of respondents answered question 6(i) on whether they preferred option A or B. This includes assignment of preference, or otherwise, from open text responses. [6]
94 out of 99 respondents (95 per cent) answered question 6(ii) on the reasons for their option preference, or lack thereof.
Figure 3-1 shows option preferences. 46 per cent of respondents preferred option A (biennial topics), whilst 39 per cent preferred option B (cut in sample size). 15 per cent decided not to select a preference; 9 per cent of all respondents specifically stated they did not prefer either option, whilst 6 per cent did not answer the question.
Figure 3-1: Option preferences
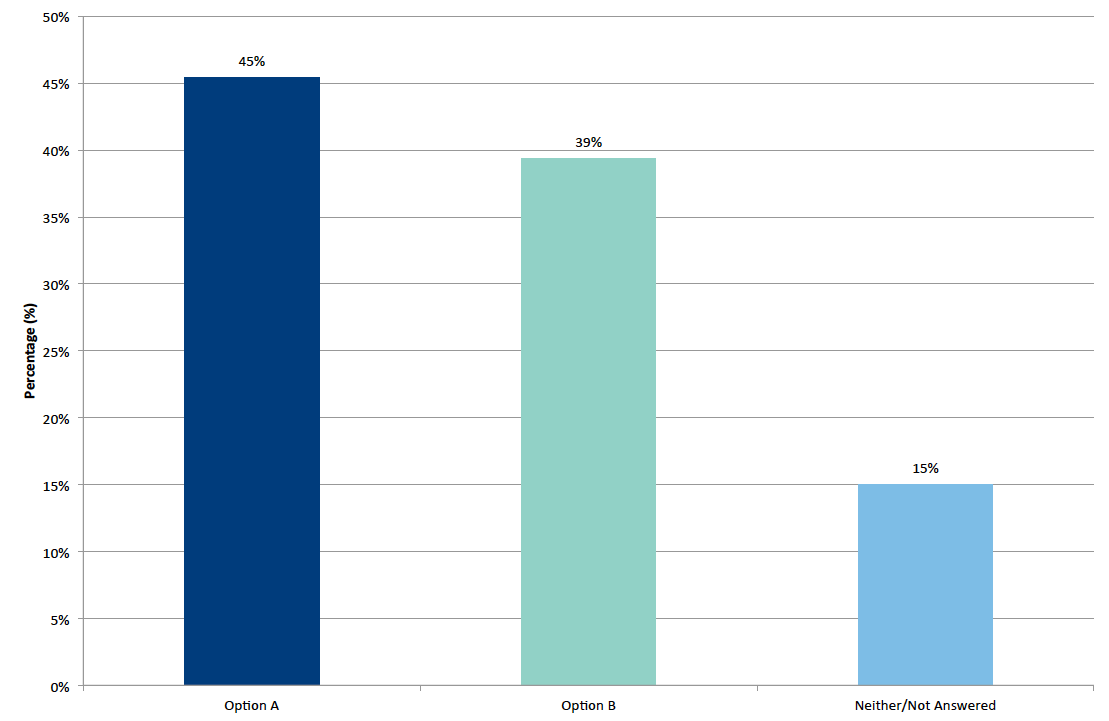
However, there was a different pattern of option preferences across the different sectors, as can be seen in Figure 3-2.
Figure 3-2: Option preferences by sector
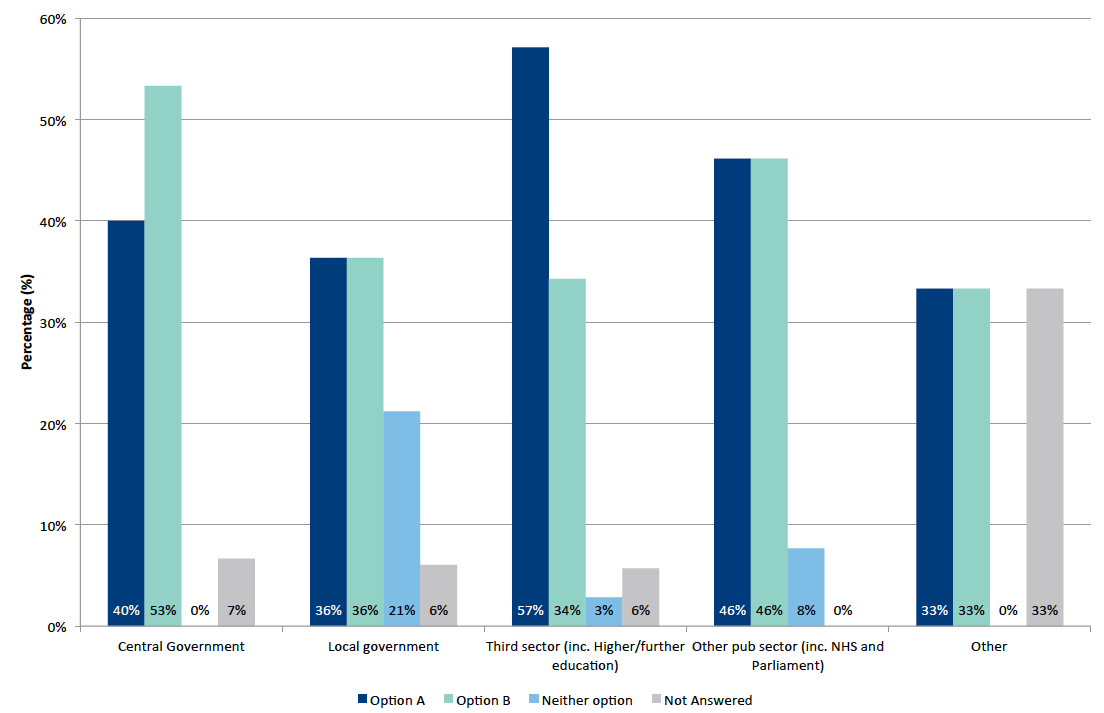
Fifty-three per cent of central government respondents (i.e. eight respondents mostly Scottish Government lead analysts responding after consulting with their policy colleagues) preferred option B compared to 40 per cent for option A (six respondents) with seven per cent (one respondent) not answering.
- For those local government respondents that expressed a preference, 35 per cent preferred option A and 35 per cent option B (12 respondents in each category), whilst 21 per cent stated neither option (seven respondents) and 9 per cent did not answer (three respondents).
- There was a similar split response for option A versus option B amongst other public sector respondents; 46 per cent for each option (six respondents each), with eight per cent stating neither option (one respondent).
- Fifty-seven per cent of the third sector (20 respondents) preferred option A, followed by 34 per cent for option B (12 respondents), 3 per cent for neither option (one respondent) and six per cent (two respondents) that did not answer.
It was largely local government respondents who either chose 'neither option' or not to answer at all. The main reason was that respondents had concerns about both options. However, one of the 'not answered' respondents noted that both options had pros and cons depending on the question of interest, i.e. there was no clear winner, whilst another noted that they would be happy with either option.
Reasons for option A preferences
The main reason why option A was preferred was because it maintains the higher sample size and 'robustness' of the data, with this seen to be more important than obtaining data on an annual basis.
Respondents wanted to maintain a high sample size for a number of reasons. This included precision around national level estimates and the ability to measure rarely occurring characteristics in a robust way (e.g. volunteering) and to undertake specific types of sub-group analysis such as equalities analysis.
A high sample size would also maintain provision of local authority estimates on an annual basis and this reason was cited not only by local authorities themselves, but some third sector respondents who make use of local authority data.
As outlined in chapter two, several local government representatives and local authorities themselves cited the importance of annual local authority data for the LGBF. However, in noting an option A preference Dundee City Council stated that ' …there is other data in the LGBF which similarly can't be obtained each year so it would not be a significant deterioration in the overall value of the LGBF.'
Whilst Glasgow City Council requested that the SHS team work with the Improvement Service in order to minimise the impact of changes to the SHS on the LGBF, their Chief Executive expressed a preference for option A in order to maintain the 'rigour and quality of the survey, even where this results in a delay in receiving the results.' A smaller local authority, opted for option A as well in order to maintain the overall sample size, even though they already have concerns about their current small sample size.
Other reasons for preferring option A (in magnitude of citation) included:
- There is no loss of topic/question coverage (as compared to option B) and/or the respondent was worried they would lose 'their questions' (e.g. volunteering) under option B. Third sector respondents were more likely to cite this reason than other sectors.
- Simpler to analyse performance and identify change over time, especially for local authority level data, compared to option B.
- There's a slow change in some figures over time anyway rather than year on year change.
- Less negative impact than option B, including from an equalities analysis perspective and the impact on local authority results.
- Efficiency gains to SG lead analyst teams from biennial reporting of SHS data.
- The most useful questions are the core questions and they are protected under this option.
Option A organisational impact
Question four asks 'what the impact would be of option A on an organisations' use of the SHS.' These responses can be broadly characterised on a spectrum of negative to neutral comments.
It should be noted that considerably more respondents cited negative impacts in their responses than neutral responses and these responses are reported first in the section below. In the section below views are reported from all respondents, i.e. regardless of whether they preferred option A or B.
Negative comments on option A
Loss of annual data and impact on performance monitoring
The loss of annual data for policy and performance monitoring purposes was raised by a number of respondents, most commonly local government and third sector respondents. This included the issue of biennial data gaps in formal frameworks such as the NPF, the LGBF and SOAs, making it more difficult to identify changes and assess trends over time. The Carnegie Trust noted the statutory nature of the national outcomes the 'lack of annual data would significantly reduce the impact of this overview of Scotland's Progress' (individual respondent from the Carnegie Trust).
A number of local government representative bodies ( COSLA, LGBF Board, the Improvement Service, and SOLACE) plus the Accounts Commission and some local authorities themselves, had strong views about the loss of annual data and its impact on the LGBF. The LGBF Board/Improvement Service felt that 'technically option A (and option B) would both render the SHS almost entirely unusable for the Local Government Benchmarking Framework', a view echoed by SOLACE and a few local authorities. It was stated that the omission of satisfaction data every second year from the LGBF would be a significant gap both for councils and for local citizens, and would make it more difficult for councils to monitor trends over time. The Accounts Commission felt that biennial data would not be positive in terms of public confidence in local authority performance data.
Impact on ability to assess and evaluate policies
Some respondents felt that the two year wait and gap for data on most topics would have an impact on the ability to assess and evaluate the impact of particular policies, due to the lack of a corresponding baseline and (first) impact year. This would particularly impact on specific events, such as cultural and sporting events like the Commonwealth Games, as well as fast moving policy areas (e.g. internet access) or issues that might shift quickly due to a sudden change in external circumstances, e.g. hate crime [7] .
The Child Poverty Action Group also felt that the lack of annual data under option A would '…make it increasingly difficult to establish causal links between policy interventions and changes in the experiences and perceptions of low income families. Where the impact of a policy cannot be seen for up to two years after its introduction the process of holding local or national government to account becomes more difficult.' It was further noted that the absence of annual data could also impact on local and national accountability in relation to Children's Services Planning under the Children and Young People Act which requires local authorities to establish how the delivery of their services will increase child wellbeing. The general lack of local authority level data on child poverty was also noted.
A few respondents noted that option A would introduce a delay in the opportunity to take action on change. NHS Health Scotland noted there would be reduced capacity for monitoring long term trends and 'early warnings' of change at national level.
Combining non-consecutive years' worth of data and with a lower two year sample size than option B
Several different respondents raised issues with having to combine non-consecutive years' worth of data and the lower sample size achieved over a two year period under option A compared to option B (10,100 household sample size under option A, compared to 15,000 under option B).
Some users of the SHS already have to combine two or more years' worth of data in order to get a sufficient sample size, particularly but not exclusively at local authority level. This includes some types of national level equalities analysis including sport participation data, and for the data that is being considered as a successor to the Scottish Government's housing SCORE data for social tenants. Areas which already have to combine three years of data include: transport modelling and planning, and adaptations to support independent living. One of Transport Scotland's respondents noted that 'to assume that behaviour remains constant (enough) over this period is pushing right to the limits of credulity'.
Split topics and the loss of functionality to explore relationships
The third sector, particularly Universities, were most likely to note a 'significant loss of functionality' (Professor Nick Bailey, University of Glasgow) arising from a biennial design. This would restrict the ability to undertake research and analysis to explore relationships and outcomes. As a specific example, NHS Health Scotland noted reduced capacity to examine inequalities in the social determinants of health.
In terms of other negative comments, a few respondents noted that they would be less likely to use this 'out of date' data, another that the impact could be ameliorated by bringing forward the publication date, and one further respondent that biennial data would be a concern to MSPs. At least one local authority (North Lanarkshire) noted that they would need to use their residents' survey and/or Citizens' Panel to fill the gaps in the biennial data 'against a backdrop of diminishing internal resources for this purposes.'
Neutral comments on option A
Around one in ten consultation respondents noted that there would be little or minimal impact on their organisations from option A. The reasons were as follows:
- Option A ensures consistency of questions and sample size
- As long as odd and even year questions are sensibly allocated for the purpose of cross tabulations
- Data is several years out of date when published anyway
- Most of their questions of interest are already biennial (i.e. culture, land use) or are protected as part of the SSCQ (e.g. smoking)
- Option A is a reversion back to the previous situation when local authority data was only available on a biennial basis
- Data does not change much from one year to the next (e.g. volunteering, sport and physical participation)
- Housing aspirations questions - as long as they can run in 2017
- Recycling questions - as long as they have key variables such as dwelling type included in the same year
A few responses noted that biennial data was fine for their purposes as data was not subject to wild swings between years. This was mentioned by two third sector organisations with an interest in the volunteering data, and by one local authority (Angus council) which stated that: 'The impact would be mainly on our Public Performance Reporting ( PPR) and specifically on the LGBF indicators and to a lesser extent SOA and housing reporting. As noted in response to Q3 we use a range of other information in policy-making, service planning and performance monitoring. For this reason the impact of changes to SHS will be limited.'
Reason for option B preferences
The main reason respondents preferred option B was the retention of data collection and availability on an annual basis for the majority of topics at national and local level. This included the ability to update the national indicators within the NPF on an annual basis, and so that local authorities could undertake their own monitoring, benchmarking and reporting.
Several respondents noted that option B not only provides annual data, it also provides a larger sample size every second year than option A (15,000 household sample size compared to 10,000).
As well as offering a greater precision for all estimates over a two year period, it was noted that this would be better for particular areas and types of analysis where small sample sizes were already an issue. This included the Travel Diary and transport analysis, housing analysis at local authority level, and many types of equality analysis carried out by the Scottish Government, NHS Health Scotland, EHRC and other public and third sector organisations. In particular, option B would avoid the pooling of three years' of local transport data over a six year period which is needed under option A to carry out transport modelling for investment decisions.
Other reasons that option B was preferred (in order of magnitude):
- It would maintain full functionality in terms of the ability to make annual comparisons and cross-analyse/explore relationships as topics are all covered in the same year.
- There would be an increase in (previously) 'one third sample size' questions such as recycling and land use.
- Measuring change over time would be less complex than option A where there would be gap years. Indeed, it was noted that the loss in precision in comparing single years' worth of data was bearable as the best approach to identifying real change was to look over a (consecutive) number of years.
- The increased precision of a two year rolling average at local authority level and/or that such an average was more appropriate to measure change in long term outcomes at local authority level (latter mentioned by at least two local authorities).
- Consistency in content would be more important than the overall sample size
- Assuming a straight one third reduction in sample size across local authorities, option B preserved the greatest flexibility and number of options for dealing with small sub-samples.
Option B organisational impact
Question five asked 'what the impact would be of option B on their organisations' use of the SHS'. The responses can be broadly characterised on a spectrum of negative to neutral comments and even a few positive comments. It should be noted that considerably more respondents cited negative impacts in their responses than neutral responses. Views are reported from all respondents, i.e. regardless of whether they preferred option A or B.
Negative comments
The most frequently made negative comments related to the reduction in the sample size (either at national level, local level or both) and the associated reduction in the 'robustness' and/or precision of the survey. Asides from the reduced ability to detect 'real' (i.e. statistically significant) change from one year to the next for all data, many varied impacts were noted from the overall sample size decrease including:
The impact on local authority data.
Around four in ten local government respondents either noted limitations with the current local authority sample size or that the current sample size was already too small for some local authorities, with many noting that the proposed reduction under option B would only exacerbate this. Several respondents quoted or referred to analysis undertaken by the Improvement Service on the LGBF satisfaction with services indicator. This stated that three year rolling averages would be needed to deliver the 'required level of precision' at a local level and even then that these satisfaction rates would be based on the general population and not service users [8] .
One of the smaller local authorities, East Ayrshire, highlighted that with a current annual base size of 250, the base size for some data breakdowns were already regarded as being too unreliable for publication, whilst some other local authorities highlighted the general difficulty with option B in making comparisons over time. Alongside some other small local authorities, East Ayrshire was worried that a reduction of their sample size under option B would make their local authority data unusable at a sub-group level. Several other local authorities expressed their worries that option B would make them less likely to use local authority data from the SHS and/or make it redundant due to the lower sample size.
The decline in sample size at local authority level would also impact on the Scottish Government and other public sector and third sector respondents that use local authority data as part of their monitoring frameworks or processes. This includes local authority data within the Active Scotland Framework and Scottish Natural Heritage's monitoring of strategies and policies; both stated they would need to move away from annual estimate based reporting in some way, e.g. to biennial reporting.
Impact on other sub-group breakdowns including other geographies (e.g. rural/urban) and demographic sub-groups
Several respondents expressed a general concern about the possible impact on other sub-group data. This included other geographic area statistics such as urban/rural breakdowns [9] and the ability to explore health behaviours and outcomes for children and young people. Annual active travel estimates outside the large cities (Edinburgh and Glasgow) would also be impacted, as would cultural participation estimates by area and population type.
The Child Poverty Action Group, which expressed concerns about both the options, was concerned that reducing the sample size would have a negative effect on the extent to which the impact of policy changes on children could be understood.
Nevertheless, NHS Health Scotland (who preferred option B) noted that they would still be able to produce their ScotPHO Community Health Profiles under option B (provided at local authority, Health Board and/or intermediate zone geography [10] ) as they would be able to pool two years' worth of data.
Impact on rarely occurring characteristics
A few respondents (but not all with interests in this data) mentioned that the reduced sample size would impact negatively on the precision of national level data for volunteering. Furthermore, it was noted that national estimates of harassment and discrimination, routinely broken down by age and gender, might have to move to biennial reporting.
Impact on equalities analysis
Several respondents noted the negative impact of option B on equalities analysis, particularly third sector respondents. For example, Stonewall noted that it was already concerned about the current SHS sample size for monitoring LGBT people and that if the sample size was reduced they would have to move to biennial reporting. Whilst recognising that combining two years' worth of data would mitigate against the reduction, they still preferred option A on balance. This contrasts with response from the EHRC and NHS Health Scotland who preferred option B due to the ability to pool two consecutive years' worth of data, thus enabling a finer level of sub-group analysis (e.g. in monitoring inequalities between places and sub-groups of the population) and achieving a higher level of precision over two years compared to option A. SportScotland took a similar view regarding the ability to combine consecutive years' worth of data for equalities analysis of the Active Scotland Framework (and separately for their Facilities Planning Model). Whilst recognising that combining two years' worth of data under option B would have a higher sample size, then the Scottish Government's equalities analytical team had 'slight preference for option A as the higher sample size would mean more precise annual counts of equality groups'.
This contrasts with responses from the EHRC and NHS Health Scotland who preferred option B due to the ability to pool two consecutive years' worth of data, thus enabling a finer level of sub-group analysis (e.g. in monitoring inequalities between places and sub-groups of the population) and achieving a higher level of precision over two years compared to option A. SportScotland took a similar view regarding the ability to combine consecutive years' worth of data for equalities analysis of the Active Scotland Framework (and separately for their Facilities Planning Model).
Other more specific impacts included:
- NRS would probably not use the SHS data as the basis of their household projections
- One public sector respondent said they might switch to biennial reporting anyway under option B due to the lower sample size.
Other negative comments on option B included:
- Several third sector respondents were worried about the loss of questions on their topics of interest, including volunteering, greenspace, and sport and physical activity.
- A few respondents, spread across sectors, did not know what the impact would be on policy development as the consultation did not specify what questions would be lost under option B. These respondents noted that they may need to buy alternative data sources to replace the lost data.
- In a similar vein, a few local authorities noted that they would need to use alternative data sources, including commission their own survey, which would reduce the value of the SHS.
Neutral to positive comments on option B
A number of neutral to positive comments were raised by a range of respondents. Some responses below echoed the reasons why some respondents preferred option B. These were as follows:
- Relative consistency with previous years including majority of topic coverage.
- The annual sample size is still large enough for major sub-groups and larger local authorities. One respondent (central Government) noted that option B could still provide annual estimates for the large and medium sized local authorities.
- Ability to combine current years of data and achieve a larger sample size than option A in order to get viable sample sizes for detailed sub-group analysis and/or to improve the precision of larger sub-group estimates.
- A few local authorities noted that the larger local authority (two year) sample size (compared to option A) and the increase in reported precision offered by the two year rolling averages was useful. This was particularly the case for active travel where there are small sample sizes.
In particular, it was recognised by these respondents that such averages would make it easier to identify differences between local authorities, although it would make it more difficult to identify change in the short term. Nevertheless, Aberdeenshire Council noted that two year rolling averages still show change over time and that the 'smoothing of estimates may also engender a more strategic, long term outlook as significant year-on-year fluctuations would be less discernible.'
- Some of the concerns around falling response rates seen in other surveys would be partly alleviated by a reduction in the sample size as some of the problems with response rates are in part due to a lack of capacity to do with the volume of fieldwork being demanded in Scotland.
Several respondents, spread across sectors, noted that option B would have little impact, because:
- There would be an increase in their 'one third sample size' questions (recycling, internet, SHCS data)
- They have worked with smaller samples and/or confidence intervals are wider but still OK for analysis
- All the data is still available annually
- LA data was previously only available every two years so (only) reverting back
- A full range of data sources were used in policy making, service planning and performance monitoring (Angus council)
- If the current streaming of physical and SHCS household questions together is maintained.
Option A biennial topics - preferences for coverage of topics in 2017 and 2018
In the consultation document, it was noted that under option A (biennial) half of the topics would be asked in 2017 (odd year) and half in 2018 (even year). Question seven asked respondents for their views on what topics should be asked in 2017 and which should be asked in 2018.
Twenty seven out of 99 (27 per cent) respondents provided a comment on question seven other than no opinion. However, only 18 respondents (18 per cent) stated any preference for odd/even years, with some providing multiple suggestions. Some respondents suggested ways of splitting the survey, but did not state a preference for which questions appeared in which years and some used the opportunity to identify variables that they think should either be protected or become core questions as part of the SSCQ.
Of those that specified an odd/even year reference, the most frequent preferences were for sport and culture to be asked in 2017 (three and two responses respectively; see Table 3-1). The reason given for the sport questions to be asked in 2017 was to enable monitoring of potential impacts of the 2016 and 2018 major sporting events (e.g. the Olympics and Commonwealth games). Conversely, one of the preferences was for the sport questions to be asked in 2018. No reason was given for this was preference.
The preference for the culture questions to be asked in 2017 was so that the current biennial topic pattern is followed. Likewise, asking transport and volunteering questions in 2018 so that the current biennial pattern is maintained was also mentioned by respondents.
Other preferences for 2017 occurred only once, with one respondent stating a preference for local government services, neighbourhoods and communities, local environment and culture all being asked together in 2017.
A few other respondents stated a preference to group similar topics together without specifying a preference for a particular year. This included the following topics:
- Culture and natural environment
- Economic activity and finance
- Neighbourhoods and communities along with housing
Table 3-1: Preferences for coverage of topics in 2017 and 2018
| Year |
Topic |
Count |
Reasoning |
|---|---|---|---|
| 2017 |
Housing aspirations |
1 |
To be able to combine the sample size with the new questions asked in 2016 |
| Culture |
2 |
To allow to be combined with current biennial topic pattern. |
|
| Employment/Income |
1 |
None |
|
| Environment |
1 |
None |
|
| Financial Inclusion |
1 |
None |
|
| Fuel poverty & heating |
1 |
To maintain continuity of data |
|
| Green space |
1 |
To allow publishing State of Scotland's Green space report in 2018 (as is based on SHS data) |
|
| Internet |
1 |
To have time to explore options to deal with the loss of annual data |
|
| Local government services, neighbourhoods and communities, local environment and culture |
1 |
The implementation of Scotland's National Strategy for Public Libraries: Ambition and Opportunity (2015-2020) is being monitored over this timeframe and 2017/2019 will provide a valuable insight to the progress against the National Outcomes. |
|
| Neighbourhood |
1 |
None |
|
| Resilience |
1 |
The resilience questions were rested in 2016 |
|
| Sport |
3 |
To monitor potential impact of sport events in 2016/2018 |
|
| Volunteering |
1 |
None |
|
| 2018 |
Sport |
1 |
None |
| Volunteering |
1 |
To continue the pattern |
|
| In the same year (no year preference stated) |
Culture and natural environment |
1 |
None |
| Econ. activity and finance |
1 |
Group similar topics together |
|
| Neighbourhoods and communities with housing |
1 |
Group similar topics together |
Option B - views on how to achieve savings needed in interview time
It was noted in the consultation that under option B (reduction in sample size), a small reduction in full sample topic coverage of around 4 minutes would be necessary in order to maintain the current one third sample questions at their present sample size. Question eight asked respondents to select how they preferred to achieve the needed reduction from the following four methods:
i. By cutting topics completely
ii. By reducing breadth of larger topics
iii. By introducing more biennial topics and questions; or
iv. By introducing more one third sample questions.
Seventy respondents out of 99 (71 per cent) provided a response to this question.
Nearly three in ten respondents (28 per cent) preferred the option of introducing more biennial topics and questions. This was closely followed by the option of reducing the breadth of larger topics (25 per cent). Cutting topics (6 per cent) and introducing more one third sample questions (11 per cent) were the least popular options. Close to three in ten (29 per cent) did not answer this question (see Figure 3-3).
Figure 3-3: Option B how to achieve savings in interview time
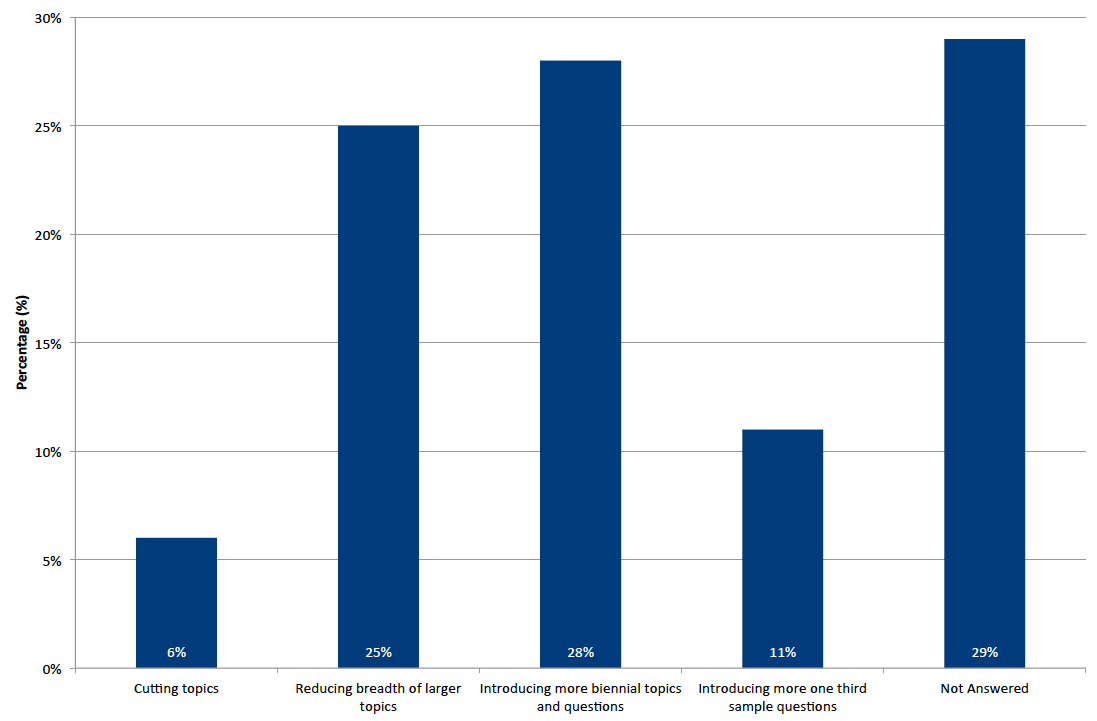
Figure 3-4 shows how respondents from different sectors responded to this question. Central government respondents favoured 'introducing more one third sample questions', followed by 'introducing more biennial topics and questions'; the other public sector and third sectors preferred 'introducing more biennial topics and questions'; and local government respondents favoured 'reducing breadth of larger topics', although nearly half of respondents from this sector did not respond to this question. Across all sectors, 'cutting topics' was the least popular option.
Figure 3-4: Option B how to achieve savings in interview time by sector
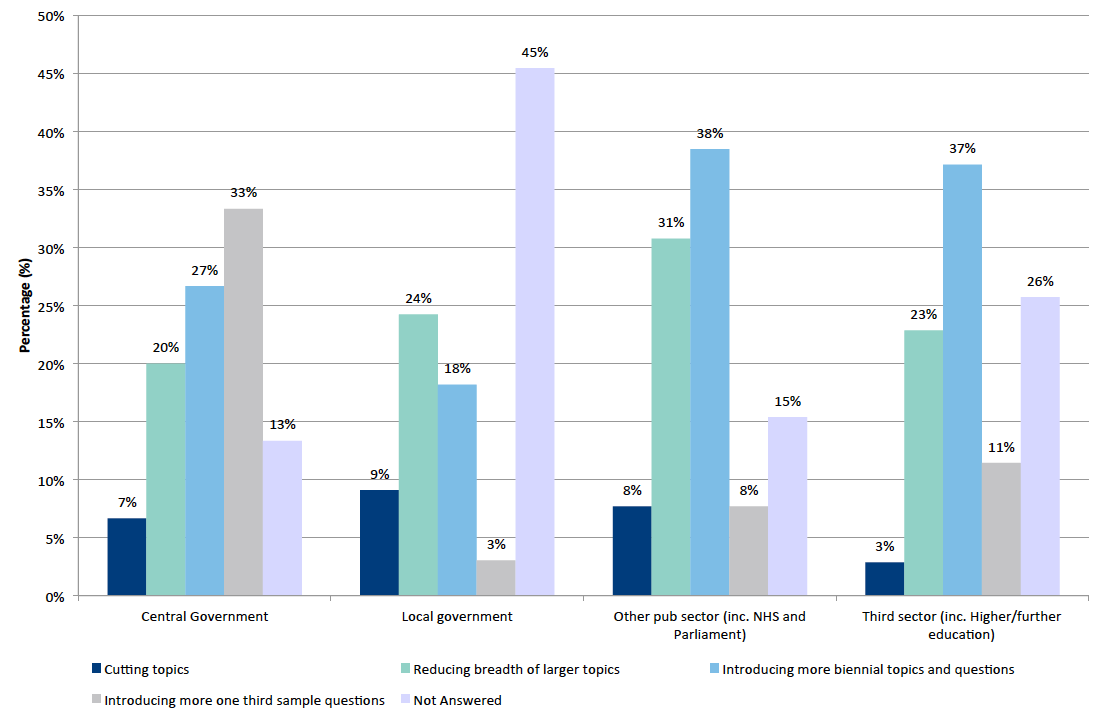
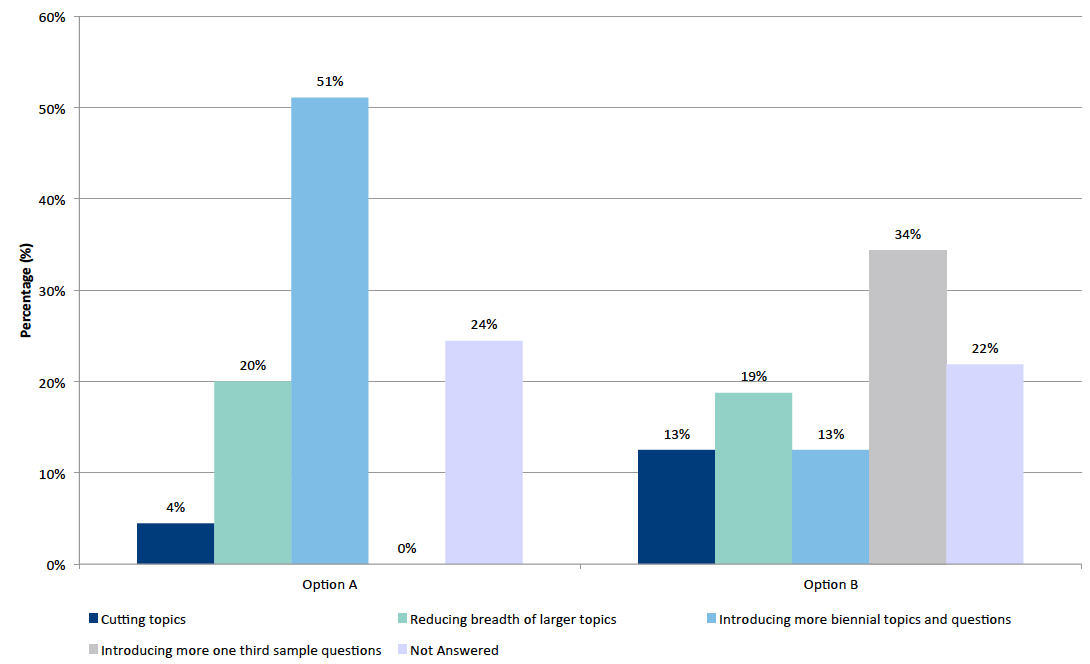
Figure 3-5 shows differing views on reducing topic coverage depending on whether option A or option B was preferred overall. Unsurprisingly, just over half (51 per cent) of those that preferred option A also preferred the option of introducing more biennial topics. However, only around one in ten (13 per cent) who had preferred option B preferred biennial topics to reduce topic coverage. The most popular option with respondents who preferred option B was the option of introducing more one third sample questions (just over a third; 34 per cent).However, none of those who selected option A selected this option to reduce topic coverage. Around one in five in each group preferred reducing the breadth of larger topics. The least popular option for those that preferred option A was to cut topics (4 per cent). The least popular option with respondents who preferred option B was introducing more biennial topics or questions and cutting topics (both 13 per cent). Around a quarter of respondents in each group did not answer this question (24 per cent for option A and 22 per cent for option B).
Figure 3-5: Option B how to achieve savings in interview time by whether chosen option A or option B [11]
Question nine asked an open question about respondents' views on the topics that they used that could be: i. Cut completely and/or reduced in breadth; ii. Go biennial; iii. Move from full to one third sample.
Seventy one (72 per cent) of respondents provided a response to this question.
Around a third of respondents who answered this question highlighted ways in which specific topic areas or questions could be reduced. The remaining two thirds of respondents did not identify how reductions should be made and provided more generic responses e.g. variables where change is fairly slow. Some respondents also took the opportunity to argue their case for not making reductions in various ways, some of which were reductions to topics that the respondent themselves did not use.
Looking more closely at the responses that suggested specific ways to reduce the SHS questionnaire time, the most popular was to make topics biennial (around seven in ten).
Overall there were many conflicting responses in trying to identify specific topic areas for some kind of reduction or change. The majority of the suggestions were changes to peripheral questions that were subject to pre-filters (and so not asked of everybody); to factual questions that would take up very little interview time in the first place; or to important cross tabulation variables.
Overall, the responses showed that there was no overarching view of the survey and, despite some well thought out responses, respondents found it difficult to come up with usable suggestions. One respondent summed this up with the following:
'All topics provide value, reductions should be shared equally. Would prefer SHS to make specific recommendations, as there is unlikely to be comprehensive expertise in all question areas in any other organisation' (Edinburgh City Council).
Some topic areas were identified as potential candidates for change. For example, a number of responses from local governments stated that data on local service satisfaction, local government perception and recycling is collected locally through citizen and user surveys. Likewise, a number of the questions relating to health which do not fall under the protective blanket of the SSCQ, are covered in the Scottish Health Survey (e.g. number of cigarettes smoked daily). The internet, transport and travel, culture and sport, housing and environment sections were mentioned in several responses.
Option B reporting of local authority level data
Question ten asked respondents their opinions on whether under option B (cut in sample size) how they would prefer local authority data to be published. The question was split into two parts. Question 10(i) was a quantitative question where respondents were asked to select which of the following two methods they preferred local authority data to be published:
i. Two year rolling average basis every year; or
ii. Two year basis every two years (i.e. 2017 and 2018 data would be published in 2019, 2019 and 2020 data would be published in 2021).
Question 10(ii) asked respondents to explain why they had selected the method they had in question 10(i).
Seventy out of 99 (71 per cent) respondents provide a response to question 10(i) and 71 (72 per cent) to question 10(ii).
Over half of all respondents (54 per cent) stated a preference for local authority level data on a two year rolling average basis every year (see Figure 3-6). Just under a fifth (17 per cent) of all respondents stated a preference for data releases every two years. However, nearly three tenths (29 per cent) of all respondents did not answer this question.
Figure 3-6: Preference for frequency of production of local authority data
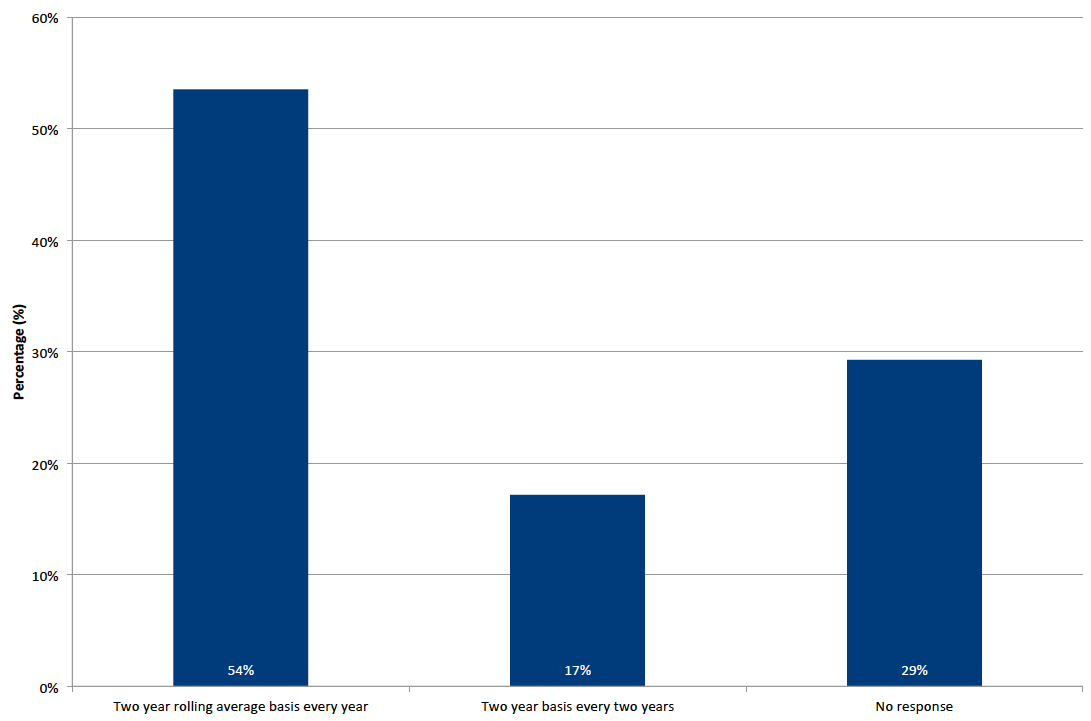
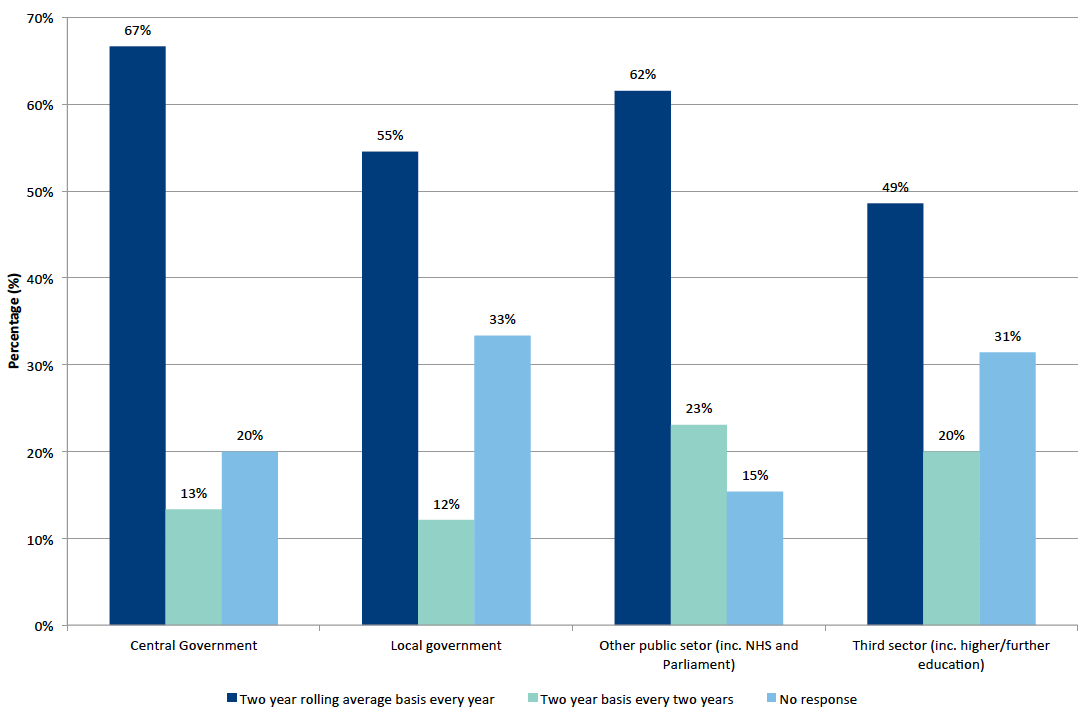
Figure 3-7 shows the preference for frequency of production of local authority data by sector. At least 49 per cent of responses from each sector (with the exception of 'other') preferred the option of annual reporting of local authority data. However, between to tenths and a third of respondents in each sector (excluding 'other') did not answer question 10(i).
Figure 3-7: Preference for frequency of production of local authority data by sector
The comments from those who preferred the option of getting data on a two year rolling average expressed a preference for up to date, annual data releases at local authority level expressed concern that releasing the data every two years would result in out of date information. This would result in short-term monitoring being no longer effective as a consequence. Although local authority level data releases from the SHS have only been available on an annual basis since 2012, a number of local government responses noted that annual reporting of local authority level data was now a statutory requirement.
The comments from the respondents who preferred a data release every two years expressed concerns about being able to identify change over time if a two year rolling average approach was taken. They preferred to wait for what they saw as more robust and accurate data which would enable small changes to be identifiable.
A third sector respondent queried whether getting both types of release was a possibility.
Contact
There is a problem
Thanks for your feedback