Council Tax collection statistics 2017 to 2018
Collection rates for each local authority for billing year 2017 to 2018, and all previous years.
This document is part of a collection
4. Further context around Council Tax
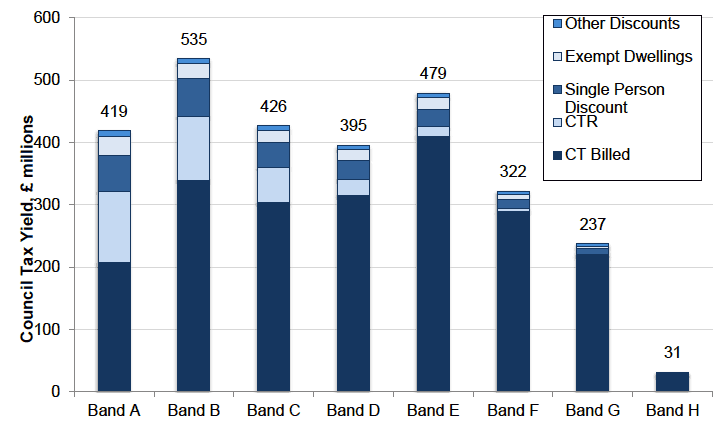
Chart 4: Council Tax Potential Yield (£ millions), 2016-17

Source: Scottish Local Government Financial Statistics 2016-17, http://www.gov.scot/Publications/2018/02/1225
Local authorities are responsible for billing and collecting Council Tax. Before the start of each financial year, local authorities issue Council Tax bills to householders in each dwelling. Each Council Tax bill is calculated by applying the appropriate band rate for the local authority, then applying any discounts, exemptions and reductions. Chart 4 illustrates the breakdown of the gross Council Tax potential yield into Council Tax billed and the amounts not billed due to Council Tax Reduction (CTR), discounts and exemptions. This publication is concerned with the Council Tax billed each year, which for 2016-17 was approximately £2.1 billion .
Table 6: Local Authority Revenue Funding, 2016-17
| Income Source | Funding (£000s) | Proportion |
|---|---|---|
| General Revenue Funding | 6,839,251 | 58.4% |
| Non-Domestic Rates | 2,768,500 | 23.6% |
| Council Tax | 2,090,754 | 17.9% |
| Other Sources | 9,540 | 0.1% |
| Total Funding | 11,708,045 | 100.0% |
Source: Scottish Local Government Financial Statistics 2016-17, http://www.gov.scot/Publications/2018/02/1225
In 2016-17, the latest audited figures, Council Tax income (for all billing years) amounted to £2.091 billion. This accounted for 17.9 per cent, just over one-sixth, of total local authority revenue funding (£11.708 billion).
Contact
There is a problem
Thanks for your feedback