Effectiveness of actions to reduce harm from nuisance calls in Scotland
Research commissioned to analyse the impact of actions set out in the Nuisance Calls Commission action plan, and to examine the outcomes of past interventions.
Annex J: Analysis of trueCall data for Scotland
J.1 Introduction
For this project, Steve Smith of trueCall has carried out several special analyses of the data that many trueCall users in Scotland contribute to the trueCall nuisance call database (and, for comparison, similar data for the rest of the UK). As explained elsewhere in this report, these users are divided into two broad categories depending on their type of unit or settings:
- “vulnerable trueCall users”, defined as those who have a trueCall unit marketed as “trueCall Secure”, or who have the regular trueCall Call Blocker product but have configured it with settings designed for people with dementia or similar conditions (‘Lock Down’);
- “standard trueCall users”, who are all other users.
The definition of “nuisance call” used in these analyses is discussed in Annex A. Throughout the UK, vulnerable trueCall users receive distinctly more nuisance calls than standard trueCall users.
We could not expect Ofcom’s diary surveys to reflect the levels of nuisance calls experienced by vulnerable trueCall users, both because the sample sizes are too small to properly represent this category, and because many people in this category – for example those with dementia – would not have the capacity to reliably and accurately complete a diary. And the levels of nuisance calls recorded by even standard trueCall users are considerably higher than those emerging from Ofcom’s landline diary surveys, for reasons which include:
- trueCall users are a self-selected sample of people who are sufficiently bothered by nuisance calls to buy and install a premium call blocker.
- Ofcom’s landline diarists record only the nuisance calls that they personally receive, which in households with more than one adult will be less than those received by the household as a whole.
- trueCall units record every nuisance call, whether or not anyone is at home. Ofcom diarists can record only those calls that they receive when they are at home, and may occasionally fail to record some calls that they do receive [140] .
We believe however that the composition of nuisance calls received by trueCall users should be a good guide to the composition of nuisance calls received by active landline users in general, even if not to the level.
Concentrated efforts by some Scottish local authorities and Trading Standards departments to protect vulnerable adults from nuisance calls have led to relatively high numbers and proportions of vulnerable trueCall users in Scotland. This situation reflects these efforts rather than any significant difference between the Scottish and UK populations. Our analyses treat vulnerable and standard users in each population separately, so that this concentration of vulnerable trueCall users in Scotland does not affect our findings.
J.2 Nuisance calls into the UK and Scotland
Figure 53 and Figure 54 demonstrate that levels of non-nuisance calls are similar between the UK and Scotland, and also between vulnerable trueCall users and standard trueCall users. However, there are large differences between levels of nuisance calls, both between the UK and Scotland, and between vulnerable trueCall users and standard trueCall users.
A decline in nuisance calling may be detectable in the 2017 figures, but it may be too soon to say.
Figure 53: Calls received per trueCall unit in four weeks in the UK except Scotland, 2014-2017
| 2014 | 2015 | 2016 | 2017 (6 months) |
||
|---|---|---|---|---|---|
| Standard trueCall users | Incoming calls | 61 | 60 | 53 | 50 |
| Non-nuisance calls | 38 | 37 | 35 | 33 | |
| Nuisance calls | 23 | 23 | 18 | 17 | |
| Vulnerable trueCall users | Incoming calls | 64 | 81 | 76 | 71 |
| Non-nuisance calls | 33 | 40 | 41 | 42 | |
| Nuisance calls | 31 | 41 | 34 | 29 | |
| All trueCall users | Incoming calls | 61 | 65 | 61 | 59 |
| Non-nuisance calls | 37 | 38 | 37 | 37 | |
| Nuisance calls | 24 | 28 | 24 | 22 | |
Figure 54: Calls received per trueCall unit in four weeks in Scotland, 2014-2017
| 2014 | 2015 | 2016 | 2017 (6 months) |
||
|---|---|---|---|---|---|
| Standard trueCall users | Incoming calls | 72 | 75 | 63 | 58 |
| Non-nuisance calls | 40 | 39 | 35 | 33 | |
| Nuisance calls | 32 | 36 | 28 | 26 | |
| Vulnerable trueCall users | Incoming calls | 64 | 94 | 87 | 78 |
| Non-nuisance calls | 33 | 45 | 46 | 46 | |
| Nuisance calls | 31 | 49 | 40 | 32 | |
| All trueCall users | Incoming calls | 69 | 84 | 76 | 70 |
| Non-nuisance calls | 37 | 42 | 41 | 41 | |
| Nuisance calls | 32 | 42 | 35 | 29 | |
Figure 18 and Figure 19 show these features graphically. Similar figures and charts have been studied for all other countries and statistical regions of the UK; it is Scotland that stands out as different.
Another difference appearing in the charts is the large peaks and relative troughs in the Scottish profile. This is not just a sample size phenomenon – it does not appear in other regions of similar size. This is examined in more depth below, and found to be related to focused calling campaigns from a few originating numbers.
J.3 Nuisance calls to standard trueCall users in Scotland and rest of UK
J.3.1 Scam and suspicious calls
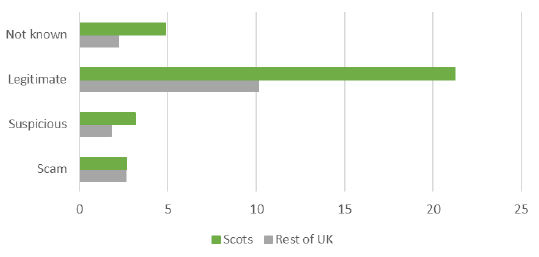
We distinguish between the three grades of severity of nuisance call described in Figure 55.
Figure 55: Grades of severity of nuisance calls
| Grade | Description | Relation to Annex A taxonomy |
|---|---|---|
| Legitimate | Legitimate products are being sold over the phone, either in a legitimate way or with some breach of the PECR or persistent misuse regime. | Estimated at 41% of nuisance calls in Figure 31 – described in its notes 4 and 5. |
| Suspicious (mis-selling) |
There is a legitimate product, but sales techniques used are illegitimate. This may involve the gathering of sales leads under false pretences, misleading or exaggerated claims for the product or service, a ‘hard sell’ approach, the targeting and exploitation of vulnerable consumers, etc. Some financial risk or unnecessary inconvenience is involved for the consumer. | Estimated at 38% of nuisance calls in Figure 31 – described in its note 6. |
| Scam | There is no legitimate product or service - the purpose is to deceive in order to get money or personal information from the consumer. | Estimated at 19% of nuisance calls in Figure 31 – described in its note 7. |
Figure 56 shows the results of an analysis of the top 250 nuisance calling numbers into Scotland and the top 250 nuisance calling numbers into the rest of the UK. It analyses the calling numbers by source (if this can be identified from the calling number) and groups them by these three grades.
Analysing the top 250 numbers making nuisance calls, Scots receive 1% more scam calls, 77% more suspicious calls and 110% more legitimate calls than users in the rest of the UK.
Figure 56: Nuisance calls per month to standard trueCall units by severity, Scotland and UK
Source: Analysis of top 250 callers to standard trueCall units, January-June 2017
J.3.2 Call categories
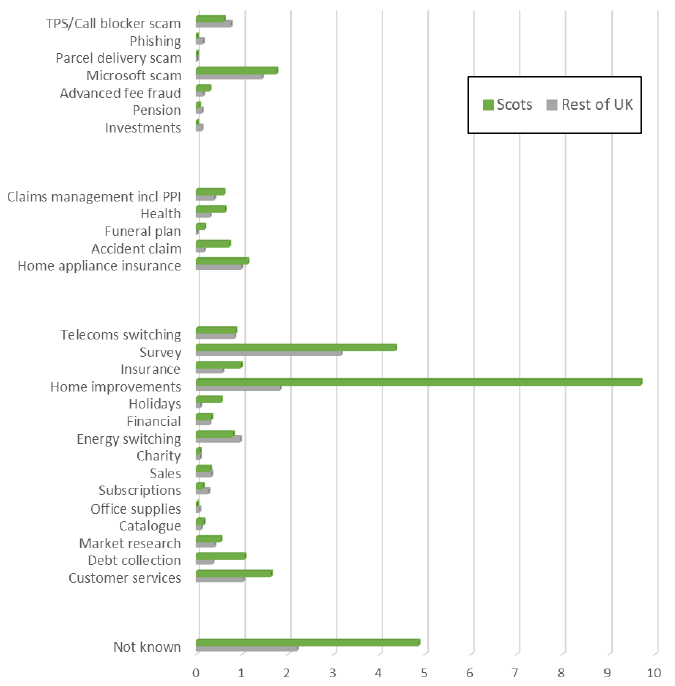
Figure 57 shows the number of nuisance calls that standard Scottish trueCall users and standard trueCall users in the rest of the UK receive in each category from the top 250 calling numbers. They are grouped by whether they are clear scams (top), suspicious (middle) or legitimate (bottom).
Scots receive more calls in most categories – in particular, home improvements and surveys. There were no major categories where Scots receive significantly fewer nuisance calls.
Figure 57: Nuisance calls per month to standard trueCall units by category, Scotland and UK
Source: Analysis of top 250 callers to standard trueCall units, January-June 2017
J.3.3 Analysis by category and originating region
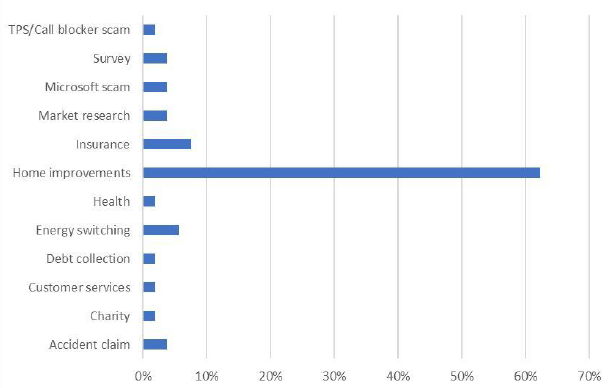
Of the 57 Scottish call centres identified in the top 250 list we were able to identify the category for 53, as shown in Figure 58. The overwhelming majority were calling about home improvements.
Figure 58: Nuisance calls from 53 callers in Scotland to standard Scottish trueCall units, by category
Call category Scottish calling numbers in the top 250 nuisance callers into Scotland Jan - June 2017
Source: Analysis of top 250 callers to standard trueCall units in Scotland, January-June 2017
Note that this is an analysis of calling numbers, not companies. Also, we assume that these calls came from Scotland because of the caller- ID, but if numbers were spoofed then they could have come from anywhere else. Having said this, many comments in the online databases we checked (WhoCallMe, Tellows, etc) did mention a Scottish voice (but this is not conclusive, as Scots may work in call centres outside Scotland).
The area codes of the 57 Scottish calling numbers identified in the top 250 numbers are concentrated in a small number of geographic locations listed in Figure 59.
Figure 59: Locations of call centres (for top 250 calling numbers in Scotland)
| Location | Number | Category |
|---|---|---|
| Glasgow | 13 | Home improvements (6), Microsoft scam (2), Accident claim (2), Debt collection (1), Energy switching (1), Insurance (1) |
| Kirkcaldy | 11 | Home improvements (11) |
| Edinburgh | 7 | Home improvements (2), Insurance (2), Market research (2), Customer services (1) |
| Dundee | 3 | Energy switching (2), Health (1) |
| Aberdeen | 3 | Home improvements (2), Survey (1) |
| Motherwell | 2 | Home improvements (1), TPS scam (1) |
| Falkirk | 2 | Home improvements (2) |
| Dunfermline | 4 | Home improvements (2), Charity (1), Insurance (1) |
| Others | 12 |
The concentration of home improvement calling numbers in Kirkcaldy is notable. Our research suggested that all of these callers were associated with a single company. This company was responsible for 970 calls during the six month period – 6% of nuisance calls received by standard Scottish trueCall users from the top 250 numbers, 22% of the calls originating from what we assume are Scottish call centres, and 50% of all home improvement calls received by Scots.
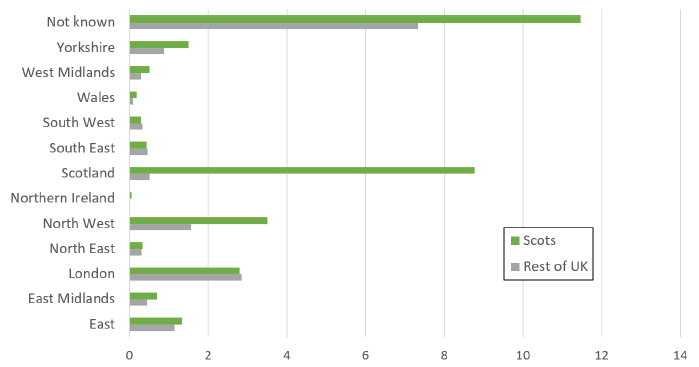
Taking these top 250 calling numbers as representative of all nuisance calls from major call centres, then 27% of nuisance calls into Scotland from major call centres come from Scottish numbers (or call centres spoofing Scottish numbers), whereas in the rest of the UK only 3% of such nuisance calls come from Scottish numbers. This additional 24% could make up a big proportion of the additional calls that Scots receive. Scots receive the same or more calls from all the other regions of the UK.
It would be expected that Scots would receive more calls from Scottish call centres – companies often do business locally – but the scale of this is surprising.
Scots receive more calls from the North West (of England), than people in other regions of the UK. This may be because of their geographic proximity to Scotland. Of course the North East (of England) is also relatively close to Scotland.
Figure 60: Nuisance calls to standard trueCall units per month, by calling region
Source: Analysis of top 250 callers to standard trueCall units, January-June 2017
Note that many of the callers categorised as ‘Not known’ will be from Scotland. For example, '08000355113’ - which is ranked number 7 for nuisance calls into Scotland – is a Scottish double glazing company.
There is good news here. It appears that a good proportion of the additional nuisance calls that Scottish households receive are from legitimate call centres based in Scotland. Identifying scammers and suspicious callers is difficult – they are operating outside or at the edges of the law – but identifying legitimate call centres is much easier. The Scottish Government is uniquely positioned to take action here, along with its business partners (who may subcontract to these call centres) and citizens (who may work in them).
J.4 Nuisance calls received by standard and vulnerable trueCall users in Scotland
J.4.1 Scam and suspicious calls
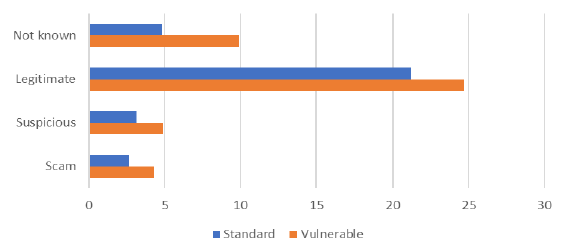
Analysing the top 250 nuisance calling numbers, vulnerable Scottish users receive 38% more scam calls, 35% more suspicious calls and 14% more legitimate calls than standard Scottish users.
Figure 61: Nuisance calls per standard and vulnerable trueCall unit per month, by severity
Source: Analysis of top 250 callers to standard trueCall units in Scotland, January-June 2017
J.4.2 Call categories
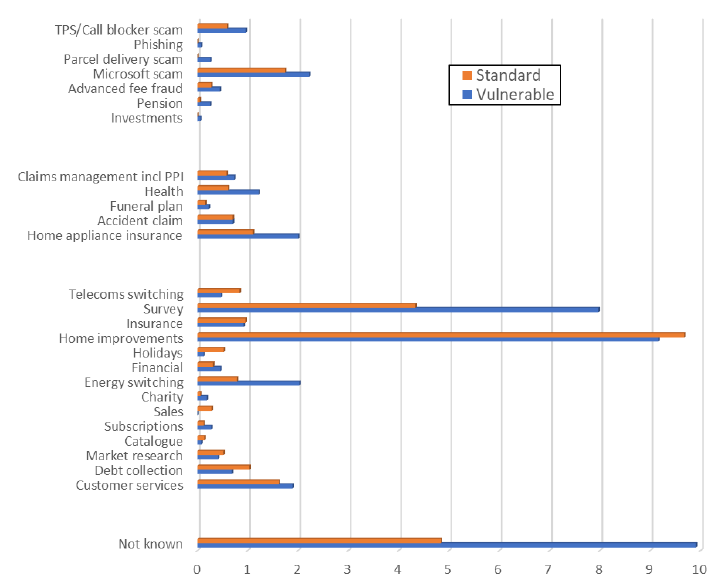
Figure 62 shows the numbers of calls that standard and vulnerable Scottish trueCall users receive in each category.
Vulnerable users receive more scam calls than standard users in every scam and suspicious category. Standard users received almost no parcel delivery, investment or phishing calls.
Standard trueCall users only receive more nuisance calls in a few categories, notably telecoms switching, home improvements, holidays, and debt collection.
Vulnerable trueCall users receive significantly more nuisance calls in nearly all other categories, notably surveys and energy switching (from the “legitimate” grade of severity) as well as all categories graded suspicious or scam.
Figure 62: Nuisance calls per standard and vulnerable trueCall unit per month, by category
Source: Analysis of top 250 callers to trueCall units in Scotland, January-June 2017
J.4.3 Nuisance call originating number types
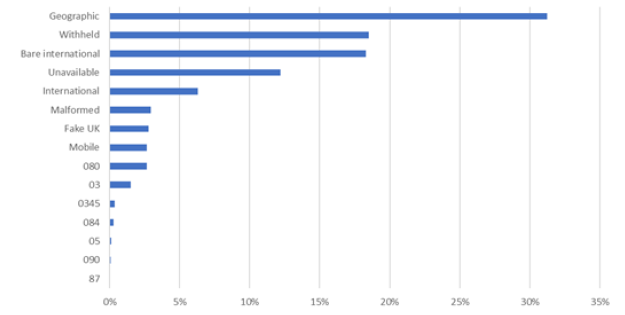
Figure 63: Nuisance calls per Scottish trueCall unit, by type of number
Source: Analysis of top 250 callers to trueCall units in Scotland, January-June 2017
Figure 63 shows the types of originating number found in our analysis of the top 250 callers into Scotland.
Figure 64 provides more detail on these types, showing whether or not they probably originate in the UK. We estimate that around 40% of nuisance calls into Scotland are from international call centres. Among these are 6% with malformed or ‘Fake UK’ numbers, which some network operators can detect already.
Figure 64: Origins of nuisance calls with different types of telephone number
| Type | Definition | Proportion | Likely origin |
|---|---|---|---|
| Geographic | A call from a correctly formed UK geographic number starting ‘01’ or ‘02’ | 31% | Probably UK |
| Withheld | The caller withheld the number. | 18% | Probably UK |
| Bare international | The call was flagged ‘International’ but there was no caller- ID number. BT is the only carrier to flag numbers as international. | 18% | International |
| Unavailable | The caller- ID was unavailable | 12% | Probably international |
| International | The number starts ‘00’ and looks like a correctly formed international number. Only very basic checks are done. | 6% | International |
| Malformed | The number is incorrect: it has too few or too many digits, starts with an incorrect prefix, or has a UK area code that has not yet been issued. | 3% | Probably international (as UK call centres might fix number formatting errors) |
| Fake UK | This is a UK format number that is flagged as ‘International’. Some may be legitimate (e.g. UK companies calling from abroad). | 3% | International |
| 080 | A correctly formed 080 number | 3% | Probably UK |
| Mobile | A correctly formed UK mobile number | 3% | Probably UK |
| 03 | A correctly formed 03 number (except 0345) | 2% | Probably UK |
| 0345 | A correctly formed 0345 number | <1% | Probably UK |
| 084 | A correctly formed 084 number | <1% | Probably UK |
| 05 | A correctly formed 05 number | <1% | Probably UK |
| 09 | A correctly formed 09 number | <1% | Probably UK |
| 087 | A correctly formed 0870 number | <1% | Probably UK |
J.5 Investigation of a peak in nuisance calls
From April 2016 to July 2016 there is an unusual peak of nuisance calls in our Scottish results that is not so apparent in results from the rest of the UK. Figure 65 displays this peak as dotted lines.
Figure 65: Nuisance calls per trueCall user per month in Scotland
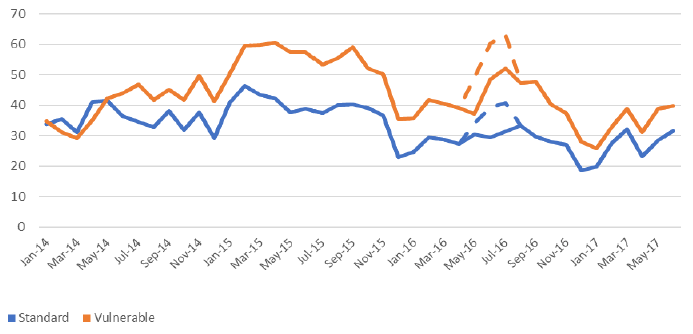
Six calling numbers were at the top of the nuisance calling list during these months and accounted for much of this peak: the solid lines in Figure 65 show the totals without calls from these six numbers. Of these six numbers:
- All were concentrating on Scotland: overall, standard trueCall units in Scotland were about 2.5 times as likely to receive any calls from these numbers as standard trueCall units elsewhere, and, among the standard units that received calls, those in Scotland received 12.0 per month on average while those elsewhere received 1.9 per month on average [141] .
- All were associated with home improvements – either boilers or window replacement.
- All were calling customers who were registered on TPS.
- All were in use for between two and nine weeks only and in these months only (except that one was in very minor use for two separate weeks in two months much later).
- Three made calls into the trueCall HoneyPots, so they were presumably carrying out random or sequential dialling.
For each of the six calling numbers, looking at trueCall units that received their calls, most units received no more than three calls (except for the particular number examined further in J.6). This suggests that the large numbers of received calls shown in other trueCall data are made up by many call campaigns each making few call attempts per called number, rather than by few campaigns each making many attempts. The call blocking equipment, if detected by call centres, may help to bring about this low level of repeat calling – but this is only a hypotheses which needs further investigation.
Taking the six calling numbers together, the mean number of calls received per trueCall unit is 11.4, even though 60% of the units received no more than three calls: 32% received no calls, 16% received one call each, 8% received two calls each, and 4% received three calls each [142] .
The calling patterns suggest that there were in some cases two or even more successive phases of calling. We look in more detail at one of these six calling patterns below, that for the number that was in use for nine weeks.
J.6 Investigation of the calling pattern for one particular calling number
The number that was in use for nine weeks had the Glasgow area code; callers from it said they were from the “Energy Council” and 99% of calls were made to households in Scotland. It seems to have been used in two successive phases (before and after 22 May 2017), each lasting four and a half weeks, as demonstrated in Figure 66. Calling volumes rose and fell during individual weeks in each phase; no calls were made on any Sundays, which are the dates identified in Figure 66, or on two Mondays, which were the bank holidays 2 May and 30 May.
Figure 66: Proportion of calls by date of call
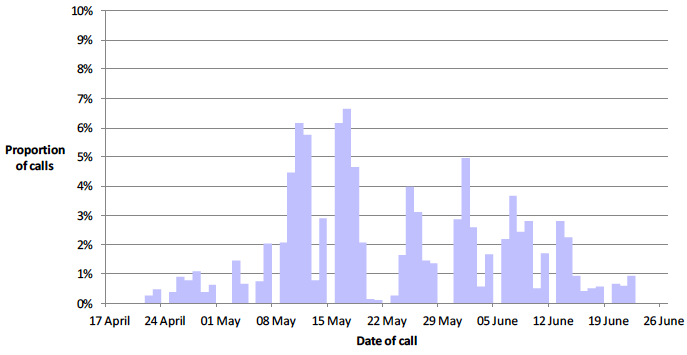
Figure 67 shows that, for this particular calling number, there were two peaks in the proportions of units receiving calls: unusually, because there were successive phases of calling, rather more trueCall units received twelve calls than received one.
Figure 67: Proportion of recipients by number of calls (considered as one pattern of calling)
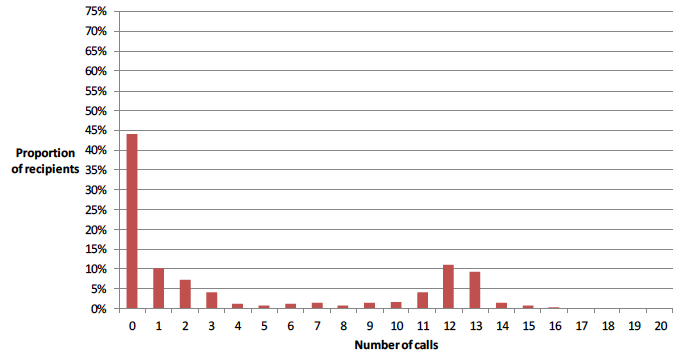
Figure 68: Proportion of recipients by number of calls (considered as two phases of calling)
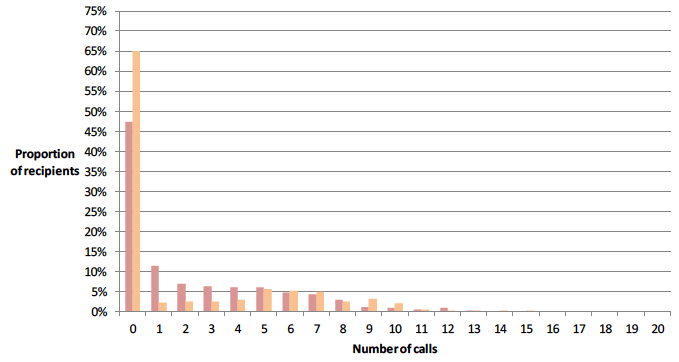
Figure 68 separates out the two apparent phases of calling as if they were independent of each other, showing them in different shades of brown.
Contact
There is a problem
Thanks for your feedback