Farm workers in Scottish agriculture: case studies
Case studies examining farm workers in Scottish agriculture and the international seasonal migrant labour market.
9 International comparisons
Section Summary:
Immigration rules and regulations, and the temporary programmes which ‘sit’ within them, vastly differ between countries, particularly between EU and non- EU countries. Exhaustively examining international regulations and schemes was outside the scope of this project. Although these differences will limit the extent to which features can be transferred to Scotland, it is important to understand the key features of these schemes when shaping any potential future Scottish system.
It seems that other countries also face challenges in accurately recording the numbers of migrant workers they have (and indeed in some cases numbers of native workers too). If a method can be found to enable Scotland’s Agricultural Census to do this more effectively in future, this could be usefully shared with other countries.
Migrant workers may be more important in some countries, and sectors within countries, than others. Certainly a key message from the Scottish agricultural sector has been that migrant workers are critical to the future of the industry, but this may not be the case elsewhere, and this context must be borne in mind when exploring the transferability of other schemes to Scotland. For example, it may affect the balance in a scheme between recording workers and restricting their entry and/or movement.
There may also be useful learning from the Canadian experience, particularly in relation to its points based immigration system. Canada also has a mechanism for negotiations to take place between the Federal and provincial Governments on the numbers of migrants for particular sectors to meet specific labour market shortages in different provinces. Information is available on Canada’s Temporary Foreign Worker Programme which may be useful to access, including a review of how critical these workers are to the agricultural sector and issues relating to their human rights.
This section of the report briefly describes the numbers of workers in five EU/non- EU countries, and outlines schemes or programmes which are in place to record their existence and to support them. Guidance was given by the project Research Advisory Group on which countries could be explored. It should be noted that a key limitation of this work was accessing information in English relating to schemes in other countries, and it was beyond the scope of this project to employ specialist translators to help in this task.
9.1 International policy learning opportunities
Methods for recording and supporting migrant workers in other countries around the world are relevant for this report as they may offer guidance for developing future schemes or measures in Scotland. This section of the report provides comparative data for four EU and non- EU countries, with a short summary section at the end which briefly outlines the key messages for Scotland. It should be noted here that detailed review of the regulations and programmes operating in other countries was beyond the scope of this project.
9.1.1 Germany
Germany has traditionally had a strong agricultural sector. Despite agriculture only accounting for ~2% of the country’s GDP, Germany’s arable land comprises over 12 million hectares, or around a third of the country’s total area (Gonzalez, 2014). Consequently, Germany produces more pork, dairy and bread goods than any other EU country. Agriculture is thus a key driver of Germany’s rural economy.
Whilst increased mechanisation has substantially boosted productivity, total agricultural employment in Germany declined by over 25% between 2000 and 2010 (Eurostat, 2012b), a trend also observed in other EU countries. By 2013, an estimated 706,300 people were regularly working in German agriculture (Eurostat, 2015), down from over 1.1 million in 2000. After accounting for time actually worked and converting this into ‘annual work units’ [16] , the equivalent of 522,700 people worked full-time on German farms in 2013. Of this total, an estimated equivalent of 55,900, or over 10%, were seasonal workers (Eurostat, 2015). Interestingly, Germany did not implement a statutory minimum wage until 2014 (Friec, 2016). Research conducted prior to this found that the growing presence of migrant labour specifically in the German meat processing sector negatively impacted wages and working conditions, with foreign workers often supplanting native ones (Hardy et al., 2012).
Germany has historically had a highly-regulated market for unskilled labour. For example, in 2006 the Bundesagentur für Arbeit (Federal Agency for Labour) mandated that 10% of seasonal farmworkers should be German. However, the scheme had mixed results, with farmers complaining that native-born workers were “ only half as efficient as the Poles” (Tzortzis, 2006). Germany was also one of two EU countries (with Austria) that prolonged restrictions on freedom of movement for workers from A8 countries until May 2011 (Hardy et al., 2012). Nevertheless, EU enlargement has seen a “ continuous inflow of migrants from A8 and A2 countries... Between 2004 and 2009 their number increased by about one third… more than half from Poland” (2012, p.351). Despite this increase, it does not appear that detailed records of migrant nationalities are maintained in English at either the federal or state level.
Immigration regulations are even stricter for non- EU/ EEA residents. Throughout the 1990s Germany forged ‘bilateral agreements’ with various countries in Central and Eastern Europe (then outside the EU) to protect worker’s rights. Whilst it may seem that these treaties would have become obsolete as partner countries have acceded to the EU, these agreements actually remain prerequisites for non- EU workers wishing to work in Germany. If this condition is met, foreign workers must first obtain a visa to enter Germany, and then a residence permit to actually work. This permit limits holders to a maximum six months’ work, and only to a handful of sectors including agriculture and fruit/vegetable processing (European Commission, 2015). However, this permit can only be approved when there is a concrete job offer, and when there are no “preferential” workers for the job in question (Bundesagentur für Arbeit, 2016).
9.1.2 Denmark
Denmark is the smallest Scandinavian country, yet 61% of its total land is used for agricultural purposes. The sector accounts for over 25% of total Danish exports, with Germany, the UK, Sweden and China being the main export markets (Danish Agriculture and Food Council, 2016).
Whilst the percentage of cultivated land in Denmark remained stable, falling by just 1% between 2000 and 2010 (2016; p.42), the agricultural labour force dropped by 22% in that period (Eurostat, 2012a). In 2013 it was estimated that the sector employed 81,000 people (Eurostat, 2015). When converted into AWU, the equivalent of 54,500 people worked full-time on Danish farms, just 2,200 of which were seasonal workers (Eurostat, 2015). However migrant inflows from A8 and A2 countries to Denmark have been substantial over this period, with more workers arriving between 2004 and 2009 than the Danish Ministry of Finance estimated would come by 2030 (Refslund, 2014). So while overall agricultural employment has declined precipitously, the proportion of workers from A8/2 countries accounted for 24% of the agricultural workforce in Denmark by 2014, having doubled since 2008 (Refslund, 2014).
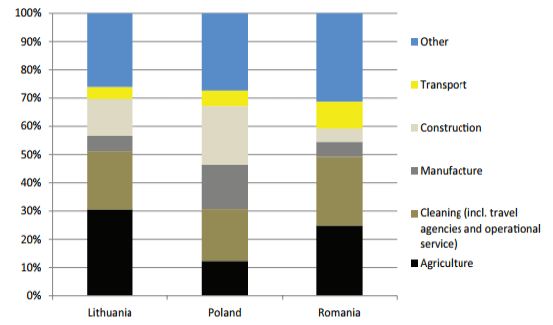
Whilst Polish nationals remain the largest migrant group in Denmark they constitute a lower proportion of the agriculture workforce compared to other A8 countries (Figure 34). Refslund (2014) posits this is because “ Poles who formed the first wave of migrants are moving into e.g. manufacturing, leaving less attractive work in agriculture to Romanians and Lithuanians…. Similar trends are observed elsewhere, e.g. cheaper Bulgarian and Romanian workers are replacing Polish workers in the German subcontracted slaughterhouse industry”. As noted above, this reinforces how the pathways that migrant workers take when finding work, including the ‘pull’ and ‘push’ factors, could have substantial implications on sectors beyond agriculture post-Brexit.
Figure 34: Differences in Danish sectorial composition by country, 2012
Source: Refslund (2014)
Denmark’s lack of a statutory minimum wage (Worstall, 2015) has also impacted the sector dramatically because the increased employment of A8/2 migrants has lowered wages and working conditions and also displaced native workers (Refslund, 2014). Further, the marked increase in subcontracting means that only about 50% of agricultural employees in Denmark are covered by collective bargaining agreements which could lead to precarious working conditions, and “ workers experiencing these conditions are typically working on time-limited, specific tasks like berry-picking and cutting Christmas trees” (Refslund, 2014)
Whilst the Danish agriculture sector is open to EU nationals [17] Denmark has implemented strict immigration policies for non- EU nationals since the most recent Folketing (Danish Parliament) election in 2015. For example, in 2016 the Danish Government repealed the Green card scheme and imposed a much stricter test for those seeking permanent residence (Khan, 2016). The right-wing Dansk Folkeparti (Danish People’s Party, which currently provides parliamentary support) has called for increasingly stringent immigration controls, which may impact the eligibility and willingness of migrants seeking to work in Danish agriculture in future.
9.1.3 Ireland
Before acceding to the EU in 1973, Ireland “ was almost totally economically dependent on farming” (European Commission, 2017). Today, the agri-food sector remains the nation’s most important, employing 8.6% of the working population (2017) and producing 5.7% (€13.54bn) of the country’s gross value added(Teagasc, 2017).
In contrast to many other EU member states, the number of full-time agricultural employees in Ireland actually increased by 5.5% between 2000 and 2010 (Eurostat, 2012c). In 2013, the number of people working on farms totalled 269,500 people. This translates to 163,700 people in AWU, with roughly 3,100 of these being seasonal workers (Eurostat, 2015; Table 9). This is nearly identical to the agriculture sector’s total AWU in 2000 (163,900), which is remarkable given that Ireland’s population swelled by nearly 20% in the inter-census decade (Eurostat, 2012c). Further, over 90% of agricultural labour input came from families, one of the highest proportions in Europe (Eurostat, 2015).
In 2007, it was estimated that about 10% of Ireland’s overall workforce were non-Irish nationals, however this population was underrepresented in agriculture, forestry and fishing, comprising just 4.2% of the workforce in those sectors (Mulligan, 2007). That same year, the Agricultural Workers Association ( AgWA) claimed that: “ While the total number and percentage of migrant workers within the sector is not known exactly, Ag WA estimates currently that up to 70% of non-family agricultural workers are international migrant workers. In certain sectors, such as the mushroom growing industry, the most significant horticultural crop grown in Ireland, it is estimated that more than 90% of those employed are migrant workers” (Murphy, 2007)
Ten years on, the profile of Ireland’s agricultural workforce remains opaque. According to An Phríomh-Oifig Staidrimh (Central Statistics Office), an estimated 5,900 non-Irish persons aged 15 years and over were employed in Irish agriculture, forestry and fishing in Q2 2017. However, these statistics provide no further information on nationality ( EU or otherwise), age, gender or the type of work (An Phríomh-Oifig Staidrimh, 2017).
As with most other EU countries, non- EEA migrants require an employment permit to work in Ireland. In 2010 approximately 1.2% of the total labour force held such a permit. Seasonal employees are eligible for the ‘Work Permit’, which covers lower-paid work, but applications for this are subject to a Labour Market Needs test, wherein the job must be publicly advertised for at least 8 weeks and an applicant must prove no other Irish/ EEA national is available ( MRCI, 2010).
9.1.4 Australia
Seasonal migration with regard to Australia must be viewed through a fundamentally different lens than the previous case studies. It is not in the EU and thus immigrant origins, profiles and pathways into the country are substantially different. ,. Despite these contrasts, agriculture is likewise indispensable to Australia. As of 2015, the sector employed 271,000 people and the gross value of farm production exceeded $24bn AUD. Australia also exports over 60% of total farm production, with the biggest markets being China, the USA, Japan, Indonesia and South Korea (National Farmers’ Federation, 2016).
Australian agriculture has historically struggled to meet labour demands with native workers. Research conducted by the National Farmers’ Federation in 2008 found that there were approximately 22,000 unfilled fruit-picking jobs in horticulture alone, and in 2014 nearly 50% of farmers said that “ a shortage of labour was the greatest impediment to their business” (Productivity Commission, 2016). The agriculture sector is thus heavily dependent on seasonal migrants to meet labour demands.
Therefore, Australia has comparatively lenient visa arrangements compared to the aforementioned case studies. The most notable of these with regard to agriculture is the Working Holiday Makers ( WHM) regime [18] , where young adults aged between 18 and 30 from selected countries can enter Australia under two 12 month visas (depending on country of residence), which enable holders to work for up to 6 months with any one employer and/or study for up to 4 months:
- Work and Holiday Visa (462): Argentina, Bangladesh, Chile, China, Hungary, Indonesia, Israel, Luxembourg, Malaysia, Peru, Poland, Portugal, San Marino, Singapore, Slovak Republic, Slovenia, Spain, Thailand, Tukey, USA, Uruguay, Vietnam [Austria and Czech Republic from 19 October 2017] (Department of Immigration and Border Protection 2017a)
- Working Holiday Visa (417): Belgium, Canada, Cyprus, Denmark, Estonia, Finland, France, Germany, Hong Kong, Republic of Ireland, Italy, Japan, South Korea, Malta, Netherlands, Norway, Sweden, Taiwan, United Kingdom ( DIBP, 2017b).
These are also both renewable for up to 12 additional months (2 years total) if the holder has worked at least 88 days in agriculture, construction or mining. WHMs are becoming an increasingly important part of the country’s seasonal agricultural labour force. In 2013-14, 239,592 WHMs entered Australia ( DIBP, 2014), representing about 33% of overall immigration to the country (Table 12). Of this total, 20% of immigrants were holding their second visa, with the vast majority of returnees being employed in agriculture, forestry and fishing.
Table 12: Australian Temporary Immigration Figures, 2013/14
| Numbers | % of Temporary Intake | |
|---|---|---|
| Working holiday makers | 239,592 | 32.5% |
| Students | 292,060 | 39.7% |
| Temporary work (skilled) | 98,571 | 13.4% |
| Other temporary visas [19] | 105,901 | 14.4% |
| Total Temporary | 736,124 | 100% |
Source: DIBP (2014)
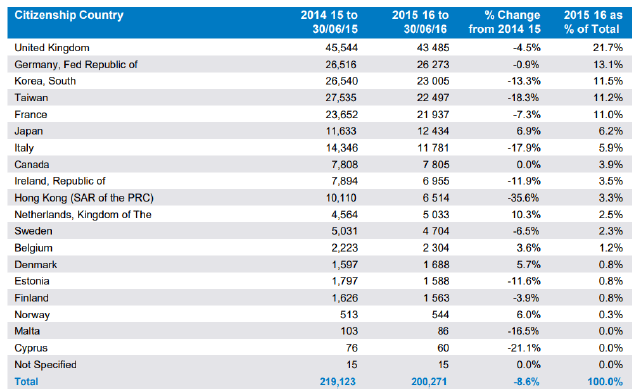
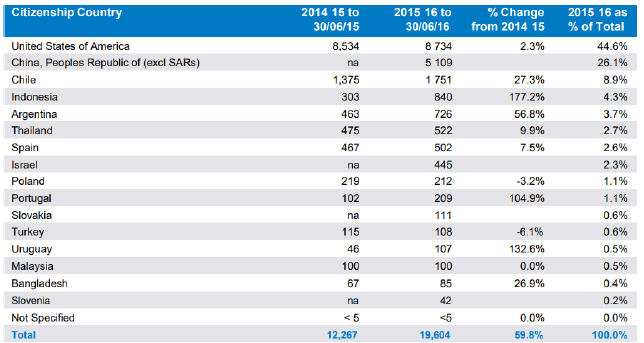
Finally, it is worth noting that there has been a net decrease in applicants for Working Holiday visas (Table 13), but a substantial increase for Work and Holiday visas (Table 14). This once again underlines the importance of ‘pull’ and ‘push’ factors in workers’ home countries in employment-driven immigration.
Table 13: Applications for Working Holiday Visa (417), 2014/15 to 2015/16
Source: DIBP (2016)
Table 14: Applications for Work and Holiday Visa (462), 2014/15 to 2015/16
Source: DIBP (2016)
The final scheme worth mentioning here is the Pacific Seasonal Worker Visa (416). First piloted between 2008 and 2011, this visa opened up Australia’s agriculture sector to seasonal workers from various Pacific Islands [20] to work in low-skilled jobs for up to 12 months. These countries continue to face significant economic hardships, so Visa 416 is intended to facilitate economic development of Pacific Island/Asian nations by providing work opportunities in Australia. The programme has seen significant uptake, increasing from around 400 in 2010/11 to nearly 3,000 in 2014/15 (Collins et al., 2016) and was renewed after the pilot period. The National Farmers’ Federation “ concluded that the program can deliver increased productivity for the agricultural sector and is a valuable scheme that brings together foreign aid and labour market policy for the economic benefit of Australia and participating nations” (Productivity Commission, 2016).
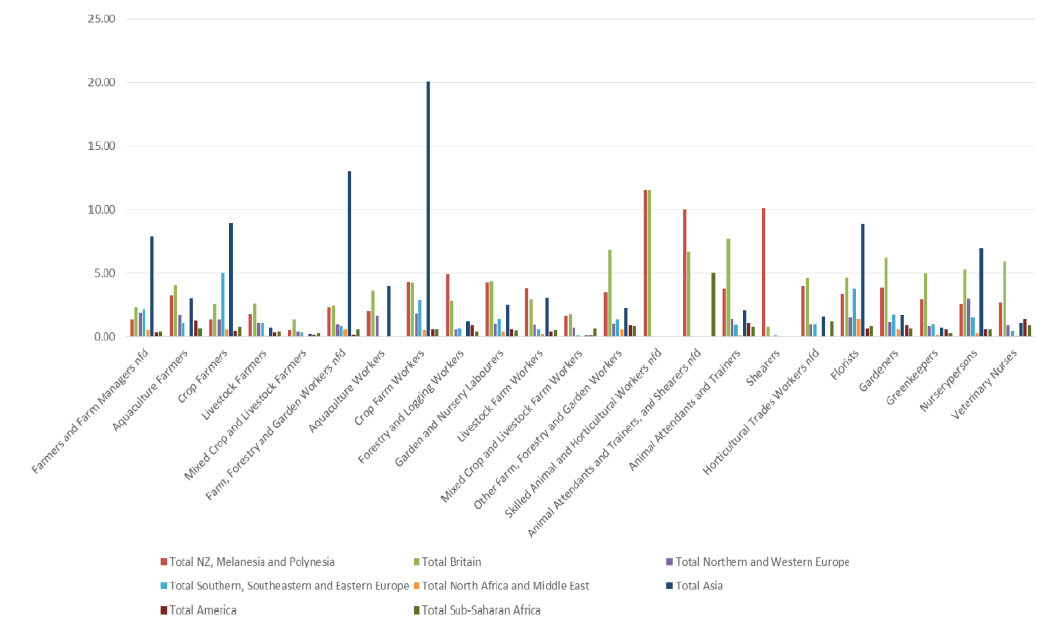
Collins et al. (2016) offer an exhaustive overview of the significant role that immigrants play in Australian agricultural production and innovation. In 2011, the sectors with the highest proportion of overseas-born workers were vegetable and mushroom growing (42%) and fruit growing (35%). Worth noting is the concentration of overseas-born workers in clusters around particular industries: “ While Chinese, Mon-Kmer, Korean and South East Asian language groups tend to be more involved in mushroom and vegetable growing, Italian, Greek and Indo-Aryan language groups tend to enter fruit and tree nut growing” (Collins et al. 2016). They also provide a detailed breakdown of non-Australian employment by sector (Figure 36).
Figure 35: Participation and distribution of migrant workers in Australian agriculture, 2011
Source: Collins et al (2016)
9.1.5 USA
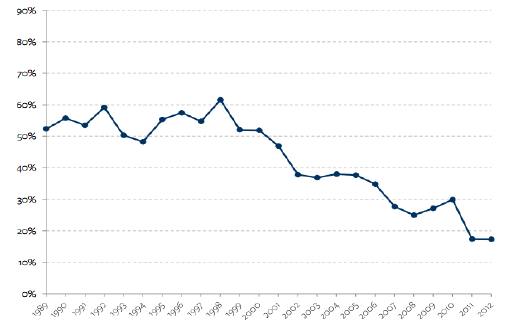
In 2015, agriculture, food and related sectors contributed nearly $1 trillion to the United States’ Gross Domestic Product and also provided about 11% of overall employment (Morrison and Melton, 2017). Migrant workers have long augmented the US agricultural labour force. It was estimated that there were three million migrant and seasonal farmworkers in the US in 1993 (National Center for Farmworker Health 2012). While the proportion of migrant farmworkers declined significantly in the past 20 years (Figure 36), they remain crucial to the functioning and viability of the US agriculture sector ( US Department of Labor, 2016).
Figure 36: Percentage of migrant farmworkers, US
Source: Fan and Perloff (2016)
The comprehensive National Agriculture Workers Survey conducted by the US Department of Labor provides a thorough overview of the agricultural workforce, including seasonal/migrant workers, in the US. The vast majority of seasonal agricultural employment comes from Mexico, accounting for 68% of hired farmworkers in 2013/14. Moreover, similar to Scotland, the majority of migrant workers were employed in the fruits and nuts sector (Table 15). However, robust estimates on seasonal and migrant labour figures are difficult to determine due to the high proportion of undocumented workers; just 53% of farm workers were legally authorised to work in 2013/14, either by being either US citizens or having legal permanent residence ( USDOL, 2016).
Table 15: Primary crop, all workers, 2013/14

Source: USDOL (2016)
The H-2A Temporary Agriculture Program is the primary legal way in which foreign-born workers can temporarily work in US agriculture, and this visa is open to citizens of 84 countries around the world. To be eligible, employers must demonstrate, and the U.S. Department of Labor must certify, that efforts to recruit U.S. workers were not successful. Employers must provide housing, and pay the higher of the applicable state or federal minimum wage, the prevailing wage in that region and occupation (as determined by the USDOL), or the regional average wage (Hertz and Zahniser, 2017).
Once again, Mexico accounts for the largest amount of H-2A visas, with 61,324 Mexicans coming in 2012 - compared to the second largest, South Africa, at 1,122 (Global Workers Justice Alliance, 2012). However, using this to estimate migrant labour numbers is challenging because government agencies record data differently. For example, in FY 2011, the US Department of Labor approved 90,328 H-2A visas, the Department of State granted 51,927 H-2A visas, and the Department of Homeland Security admitted 174,898 H-2A visa holders (2012). As such, the true scope and scale of migrant labour in the US remains opaque.
Contact
There is a problem
Thanks for your feedback