Cereal and oilseed rape harvest: final estimates - 2016
Final estimates of the cereal and oilseed rape harvest for Scotland 2016.
This document is part of a collection
3. Cereals
Production
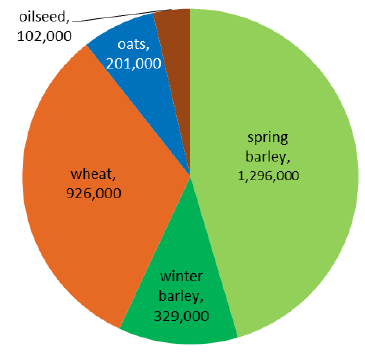
Total cereal production in Scotland is estimated to have fallen in 2016 by 348,000 tonnes to 2.75 million tonnes. With the exception of the weather-hit 2012 harvest, this is the lowest since 2007. While the volume of the harvest was poorer than expected, industry experts collecting data have reported no particular concerns over quality.
In 2015 cereals were estimated to have accounted for about 11 per cent of farm output.
Chart 2: Production (tonnes)
Area
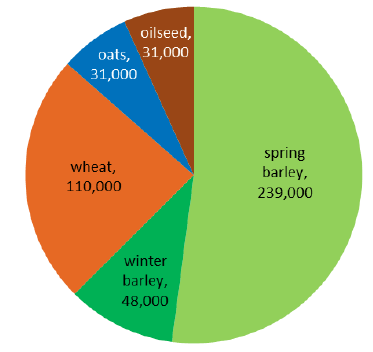
The total cereal area fell three per cent compared to 2015. About 428,000 hectares of cereals were grown in 2015/16. Areas have ranged between 398,000 hectares in 2006 and 476,000 hectares in 1997.
Chart 3: Area (hectares)
Yield
The overall yield estimate for Scottish cereals is the third lowest in the last decade, at 6.4 tonnes per hectare. The yields for all crops in this report are estimated to have fallen, with the exception of oats.
The long term trend of increasing yields remains, with the recent ten‑year average of 6.5 tonnes per hectare five per cent above the previous ten-year
Chart 4: Yield (tonnes/hectare)
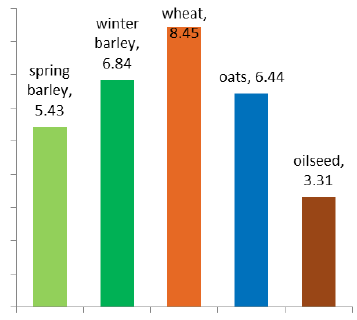
average. This long term increase is likely to be due to an improved efficiency in farming practices as well as development and use of higher yielding crop varieties. The shorter term variations in cereal yields are more likely to be influenced by weather and other conditions during the growing season
Other cereals
Triticale is a marginal crop in Scotland, grown on around 600 hectares. Because there are relatively few farms growing triticale it is difficult to provide reliable yield estimates. However, for the same reason, variances in yield have little impact on overall cereal production. Triticale production is not discussed in this release, but is included in the overall cereal estimates.
Rye is increasingly being grown, though mainly for anaerobic digestion.
Oilseed, though not a cereal, is also shown for comparison in the above charts, though is not included in calculations and commentary about cereal totals.
Charts
Chart 5 shows the areas estimated from the June Agricultural Census as bars and the estimated production and estimated average yield as lines. Area is presented in hundreds of hectares, production in thousands of tonnes and yield in tonnes per hectare.
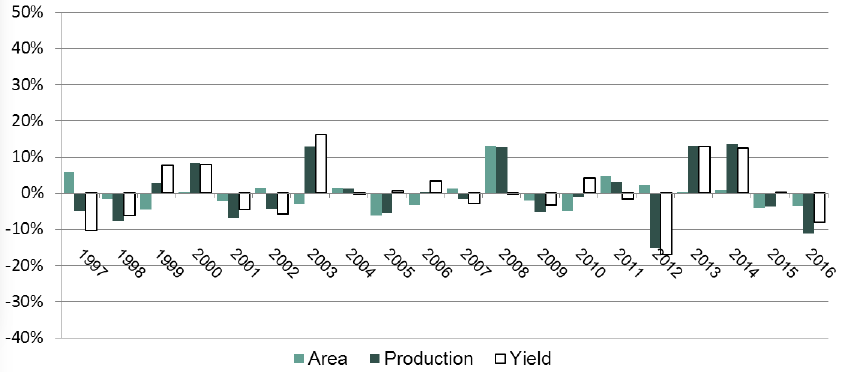
Chart 6 shows the year-on-year change of areas, total production and average yield. This allows the drivers of fluctuations in production to be more easily distinguished and gives a sense of the typical fluctuations from year to year. In chart 6 all measures are presented as the percentage change compared to the previous year.
In the following sections similar charts are used to display the results for each crop group, though the scales of the chart axes are not the same in every case.
Chart 5 - Total Cereals: Area, Yield and Production
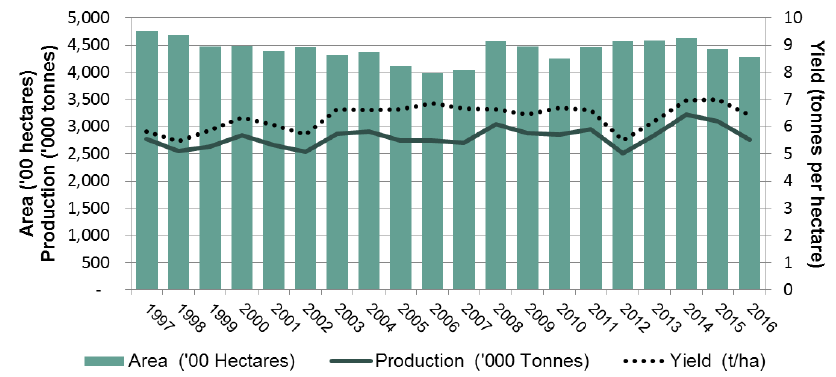
Chart 6 - Total Cereals Year-on-Year Change: Area, Yield and Production
Contact
There is a problem
Thanks for your feedback