Growing up in Scotland: the circumstances of persistently poor children
This report looks at how many children experience persistent poverty and which children are most likely to be persistently poor. It also examines the outcomes of children from persistently poor families.
chapter 4 WHAT ARE THE OUTCOMES OF CHILDREN FROM PERSISTENTLY POOR FAMILIES?
There is a wealth of information on the living standards of families with children who are in poverty, but rather less evidence on the association between living standards and persistent poverty. The analysis presented in this chapter looks directly at these issues and pays particular attention to the likely impact of living in persistent poverty on outcomes for children. The research will explore the impacts of persistent poverty on child outcomes, focusing on measures of cognitive, behavioural, emotional and health outcomes. We measure the child outcomes at the latest available time-point, GUS sweep 4, and hence represent an assessment of child well-being at the end of the period under investigation.
We provide descriptive analyses that illustrate the relationship between a child's longitudinal poverty status and each of the child outcomes. We also explore the relationship with multiple negative child outcomes. Again regression analyses are used to unravel whether persistent poverty is related to an increased risk of each, and multiple, child outcomes when other potentially confounding factors are taken into account. These potentially confounding factors include the socio-demographic variables described in the previous chapter. Throughout the chapter the main comparisons of child outcomes are made between children living in families in persistent poverty and children living in families in temporary poverty. 22
The key findings from this chapter are:
- Persistently poor GUS children appear more likely to have a range of negative outcomes, including being overweight (birth cohort only), had accidents (child cohort only), language development concerns (birth cohort only), general development concerns (both cohorts), social, emotional and behavioural difficulties (both cohorts) and multiple negative outcomes (both cohorts) (Section 4.1).
- However, when other factors are taken into account the relationship between poverty duration and child outcomes disappears. Instead we see a range of factors being associated with outcomes for these children, including gender and ethnicity of the child, family size and health of the mother (Section 4.1).
4.1 The duration of poverty and child outcomes
In this section we introduce the child outcomes that we will look at in the report. There are five in total, spanning a range of areas including being overweight, concerns over language development, and social, emotional and behavioural problems. We also explore how many of these problem outcomes children have and focus in on children that have multiple problems.
We compare the prevalence of child outcomes across the three poverty duration categories - no poverty, short-term (or temporary) poverty, and persistent poverty - using bar charts. We use coloured bars if the relationship between poverty duration and the child outcome is statistically significant. Likewise, we use white bars to denote no significant relationship between poverty duration and the child outcome. 23 Each statistical test is carried out separately for the birth cohort and the child cohort. Clearly these charts only focus on two-way relationships and in the subsequent section we see whether these relationships hold when taking other, potentially confounding factors into account.
4.1.1 Body Mass Index
The primary reason for concern about children's diets and physical activity is the effect that these have on health, both in childhood and later life, in particular in relation to being overweight and obese. Overweight and obesity are terms that refer to an excess of body fat and they usually relate to an increased weight-for-height ratio. GUS measures children's height and weight and these can be used to calculate Body Mass Index ( BMI).
BMI takes into account weight and height: it is calculated as weight (kg) divided by squared height (m 2 ). Using cut-off points derived from internationally collected data, BMI values can be used to indicate the proportion of children who are underweight, normal weight, overweight and obese. For our analysis we derive a binary categorical variable which has the following categories:
- Neither overweight nor obese
- Overweight including obese
Information on children's height and weight was previously collected in GUS sweep 2 with key findings presented in an earlier report (Bradshaw et al., 2008). That report found that most children were of 'normal weight' but around one in five were overweight (including obese). Girls were more likely than boys to be overweight, as were children living in lone parent families, White children and children with a long-standing illness. However, research has shown that different nutritional patterns among infants and young children may take some time to manifest themselves in the form of excess weight or obesity in later childhood (Ong et al., 2000). Therefore it is not necessarily the case that differences in BMI would become immediately apparent in younger children, as some changes in weight may take a longer time to emerge. Hence being able to look at BMI at sweep 4, particularly for the child cohort, is of interest.
Figure 4.1 shows the percentage of children overweight, including obese, by poverty duration. Being persistently poor was associated with an increased risk of being overweight for the birth cohort, although the difference between persistently poor children and those that avoided poverty was only four percentage points. There was no significant relationship between poverty duration and being overweight for the child cohort despite the same percentage point difference (although the relationship was significant at the 10 per cent confidence level).
Figure 4.1 Percentage of children overweight by poverty duration
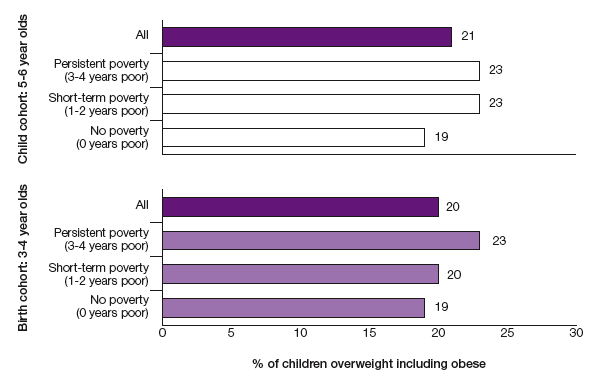
Base: Birth cohort panel children (weighted 3275, unweighted
3327)
Child cohort panel children (weighted 1805, unweighted 1817)
Note: Overweight measured using Body Mass Index ( BMI)
Note: Coloured bars indicate statistically significant
(p<0.05) relationship between poverty duration and BMI.
White bars indicate no statistically significant (p<0.05)
relationship between poverty duration and BMI.
4.1.2 Number of accidents/injuries
As well as collecting information on BMI, GUS mothers were asked if in the last year their child had experienced an accident or injury which had required medical attention. Previous analysis of GUS showed that toddlers were much more likely than babies to require NHS treatment or advice as a result of accidents, as were a slightly higher percentage of boys than girls. However, in general only a minority of parents reported that an accident or injury had necessitated such attention (in sweep 4 this was 15% of parents in the birth cohort and 18% of parents in the child cohort).
For our analysis we derive a binary categorical variable which has the following categories:
- Child has had an accident or injury that resulted in medical attention in past year
- Child has not had an accident or injury that resulted in medical attention in past year
Figure 4.2 shows the percentage of children that had an accident or injury in the last year according to poverty duration. Children in the child cohort were more likely to have had an accident or injury if their family had spent some time in poverty. Whether the poverty experience was temporary or persistent appears to make little difference. There was no significant relationship between poverty duration and having accidents or injuries for the birth cohort (although the relationship was significant at the 10 per cent confidence level).
Figure 4.2 Percentage of children that had one or more accidents or injuries in the last year by poverty duration
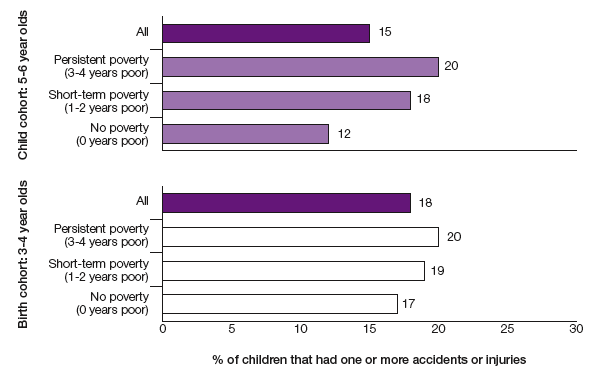
Base: Birth cohort panel children (weighted 3565, unweighted
3598)
Child cohort panel children (weighted 1941, unweighted 1932)
Note: Coloured bars indicate statistically significant
(p<0.05) relationship between poverty duration and
accidents/injuries.
White bars indicate no statistically significant (p<0.05)
relationship between poverty duration and accidents/injuries.
4.1.3 Child speech and language development
GUS mothers were asked whether they had any concerns with their child's speech and language ( e.g. the child's language was developing slowly, or it is hard for other people to understand the child). We categorised children according to whether there were concerns or not.
- Mother does not have concerns with child's speech and language
- Mother has concerns with child's speech and language
Around one in seven (15 per cent) of the birth cohort and one in nine (11 per cent) of the child cohort had speech and language concerns. Figure 4.3 shows how this varies according to poverty duration. The incidence of language and speech problems increased with poverty duration for the birth cohort and this relationship was statistically significant. Although there appears to be an increased incidence for any experience of poverty among the child cohort, this was not statistically significant (although it was at the 10 per cent confidence level).
Figure 4.3 Percentage of children whose mother has concerns about their language development by poverty duration
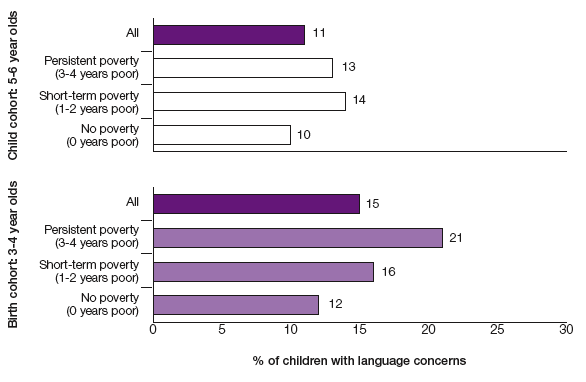
Base: Birth cohort panel children (weighted 3564, unweighted
3596)
Child cohort panel children (weighted 1931, unweighted 1941)
Note: Coloured bars indicate statistically significant
(p<0.05) relationship between poverty duration and language
concerns.
White bars indicate no statistically significant (p<0.05)
relationship between poverty duration and language concerns.
4.1.4 General development
GUS mothers were also asked about other areas of their child's development, learning or behaviour. About 1 in 8 thought their child had other general development concerns (Figure 4.5). For both the birth and child cohort there was a significant relationship with poverty duration. A longer poverty duration suggested a higher incidence of development concerns for the younger children, whereas it was any experience of poverty for the older children.
Figure 4.4 Percentage of children whose mother has concerns about their general development by poverty duration
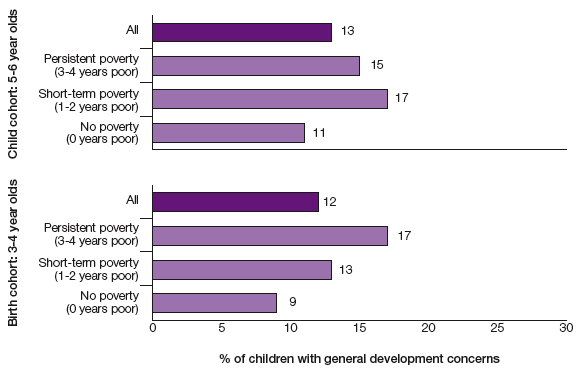
Base: Birth cohort panel children (weighted 3566, unweighted
3598)
Child cohort panel children (weighted 1931, unweighted 1941)
Note: Coloured bars indicate statistically significant
(p<0.05) relationship between poverty duration and general
development concerns.
White bars indicate no statistically significant (p<0.05)
relationship between poverty duration and general development
concerns.
4.1.5 Social, emotional and behavioural difficulties
Children's social, emotional and behavioural development is captured in GUS via the Strengths and Difficulties Questionnaire ( SDQ). The SDQ is a brief behavioural screening questionnaire designed for use with 3-16 year olds. The scale includes 25 questions which are used to measure five aspects of the child's development - emotional symptoms, conduct problems, hyperactivity/inattention, peer relationship problems and pro-social behaviour. A score is calculated for each aspect, as well as an overall 'difficulties' score which is generated by summing the scores from all the scales except pro-social.
The overall difficulties score is what we use in this analysis. It is calculated by adding together responses to 20 items from the following components:
- emotional symptoms (5 items)
- conduct problems (5 items)
- hyperactivity/inattention (5 items)
- peer relationship problems (5 items
A higher score indicates greater evidence of difficulties. There are established thresholds indicating 'borderline' (score of 14-16) or 'abnormal' scores (score of 17 or above) (Goodman, 1997). We have created a measure that identifies:
- Children with borderline or above difficulties ( SDQ of 14 or higher)
- Children below the borderline ( SDQ of below 14)
Figure 4.4 presents the percentage of children with at least borderline difficulties according to poverty duration. For both cohorts there was a significant relationship between poverty duration and likelihood of difficulties, with almost one in four persistently poor children with a borderline score or above.
Figure 4.5 Percentage of children with at least borderline social, emotional and behavioural difficulties by poverty duration
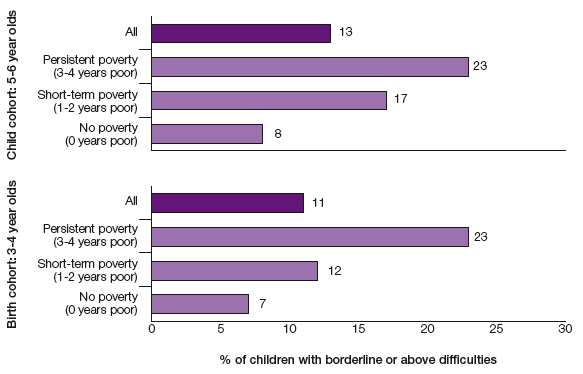
Base: Birth cohort panel children (weighted 3515, unweighted
3553)
Child cohort panel children (weighted 1907, unweighted 1923)
Note: Coloured bars indicate statistically significant
(p<0.05) relationship between poverty duration and difficulties.
White bars indicate no statistically significant (p<0.05)
relationship between poverty duration and difficulties.
4.1.6 Multiple outcomes
There is evidence to suggest that children who live in families with multiple problems are themselves much more likely to have negative outcomes. Albeit based on older children than in GUS, children aged 13 to 14 years who live in families with five or more problems (such as neither parent in work, poor housing conditions, parents with mental health problems) are 36 times more likely to be excluded from school than children in families with no problems and six times more likely to have been in care or to have contact with the police ( HM Treasury and DFES, 2007). Similar findings were reported by Oroyemi et al., (2009).
We have seen in the previous chapter that persistently poor children were also likely to live in families that were workless, of low social class, living in rented accommodation and multiply deprived areas. Here we explore whether children were more likely to experience multiple negative child outcomes the longer they lived in poverty.
We construct a measure of multiple problems by counting the number of negative outcomes each child has. So each child has a score from zero to five based on the number of outcomes that we have used in our analysis above:
- Child is overweight, including obese (using the Body Mass Index)
- Child had an accident or injury in the past year (reported by mother)
- Mother has concerns about child's language development (reported by mother)
- Mother has concerns about child's general development (reported by mother)
- Child has borderline or above social, emotional or behavioural difficulties (using the Strengths and Difficulties questionnaire)
Figure 4.6 looks at the percentage of children who experienced multiple problems (two or more) according to their longitudinal poverty status. There is a relationship between poverty and multiple outcomes for both sets of children, but the duration of poverty appears to matter most for the younger children, where we see a steep increase in the risk of multiple problems the longer they have been in poverty.
Figure 4.6 Percentage of children whose have multiple problems by poverty duration
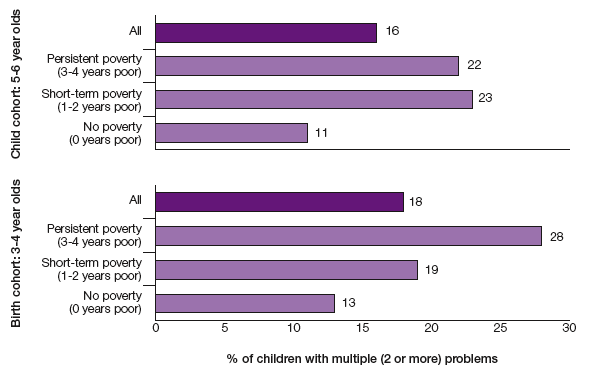
Base: Birth cohort panel children (weighted 3565, unweighted
3598)
Child cohort panel children (weighted 1930, unweighted 1941)
Note: Coloured bars indicate statistically significant
(p<0.05) relationship between poverty duration and multiple
problems.
White bars indicate no statistically significant (p<0.05)
relationship between poverty duration and multiple problems.
4.2 The association between the duration of poverty and child outcomes
The statistical analysis is based on logistic regression models and is used to determine whether the duration of poverty is associated with the indicators of child well-being used above. These were:
- Child is overweight, including obese (using the Body Mass Index)
- Child had an accident or injury in the past year (reported by mother)
- Mother has concerns about child's language development (reported by mother)
- Mother has concerns about child's general development (reported by mother)
- Child has borderline or above social, emotional or behavioural difficulties (using the Strengths and Difficulties questionnaire)
- Child has multiple problem outcomes (two or more of the above five outcomes)
In the analysis we seek to assess the importance of the duration of poverty by directly contrasting children living in persistent and temporary poverty. We also control for a range of background characteristics of children to explore the importance of the duration of poverty against other factors that could impact on child outcomes. Existing research using cross-sectional data has identified a range of factors that are associated with child outcomes, such as family size and parental health (Oroyemi et al., 2009; Barnes et al., 2008).
These factors are measured at the start of our observation period (2005-06) and used along with poverty durations to 'predict' child outcomes measured later in this period. Table 3.1 in the previous chapter shows a detailed list of the contextual variables used in the research. Of course these contextual variables are not complete and there are other factors that could be related to child outcomes that are not collected in GUS. Also, we choose not to use measures of child outcomes collected earlier in the study to predict outcomes at sweep 4. This is particularly because some were not collected in sweep 1 but also because the measures are too highly correlated with the sweep 4 outcome and using them as predictor variables would cause some difficulties with the modelling. 24 We also omit parental work intensity from our predictor variables because of the high correlation between that and poverty (see previous chapter).
Before describing the results it is important to stress again that our analyses cannot show causation, just associations in the data. However, by taking advantage of the longitudinal nature of GUS we limit the possibility of reciprocal causation, for example child outcomes measured in sweep 4 cannot be a direct cause of contextual variables measured in sweep 1. In this way, although still not formally testing causality we may be more confident about the direction of the relationships we find.
Because one of our goals is to assess the importance of the duration of poverty, we set up our analytical models to directly compare living in persistent poverty with a more temporary experience. This was done by setting 'short-term poverty' as the reference category in the regression models. In this way, we can directly compare the difference between a short-term experience of poverty and avoiding poverty on the one hand, and between short-term and a more persistent experience on the other.
The regression analysis looking at the influence of poverty duration relative to other factors on the various outcome measures is presented in Table A2.2 (birth cohort) and Table A2.3 (child cohort) in Appendix 2. The first point to make is that poverty duration is not significantly associated with child outcomes in either of the models. 25 This is rather a surprising finding, particularly as previous analysis of GUS found persistent low income to be associated with cognitive ability at age 2-3 years (Bromley, 2009). 26 However this finding can be explained in a number of ways. First we should reiterate that our measure of poverty may not be precise, most notably because GUS collects income information using just one question rather than as part of a detailed exercise. Also there is the possibility of the poverty duration and child outcome measurements not being in sync, for example persistently poor children may not be in poverty in the year the outcome is measured.
There is a wealth of evidence to suggest that poor children face other disadvantages (Oroyemi et al., 2009) and that this can reduce life chances in adulthood (Feinstein, 2003). However, most of this evidence relates to children older than those in GUS. This suggests that because the GUS children are still young, the effect of persistent poverty may not have manifested itself yet. Also the nature of the GUS disadvantage measures means that we may not necessarily expect to see large differences between children at this young age, either because variations in children are not large or the measures are not detailed enough to pick up smaller differences which may be occurring in relation to poverty impact. So, although we do not observe a direct impact of persistent poverty now, it may be that we will do in a few years time, when the GUS children are slightly older.
We mentioned earlier that previous research on family poverty has shown that mothers try to shield the effect of poverty from their children. It may be that mothers are more likely to do this, or that their efforts are more successful, when their children are very young. However, it may simply be that the child outcomes that we look at do not have a strong relationship with poverty, at least for young children, and that these outcomes are mostly driven by non-economic factors. Looking at Table A2.2 and A2.3 we indeed see that a range of non-economic factors are significant in the models. These include gender and ethnicity of the child, family size and health of the mother.
Some relationships were common for both cohorts of children. Boys were more likely than girls to experience the majority of negative outcomes we focus on (see Appendix 1 for explanation of how to interpret odds ratios). In both cohorts, girls were more likely to have a high BMI but less likely to have the other negative outcomes. Children from larger families were at risk of language problems. Also, children whose mother developed health problems during the observation period were at risk of social, emotional and behavioural difficulties and having multiple negative outcomes.
Other relationships were only evident for children of a particular age. For example, birth cohort children from ethnic minority communities were more likely to have social, emotional and behavioural difficulties, as were children whose mother had low education, whereas child cohort children from families whose parents had split up during the observation period were more likely to face multiple negative outcomes than those whose parents remained together.
There is a problem
Thanks for your feedback