Health and Care Experience Survey 2015/16 - National Results
Results from the 2015/16 Health and Care Experience Survey.
This document is part of a collection
5 GP Practices - Accessing Services
Summary
- The majority of patients report positive experiences of accessing GP services. However, these results are generally less positive than results relating to the actual care received at the practice.
- The access results have tended to have grown less positive since the previous survey, continuing a downward trend for a number of questions.
- An example of this the overall rating for 'arrangements for getting to see a doctor'. The positive rating has only dropped one percentage point since the previous survey, but this continues a trend that has seen the rating drop each survey since 2009/10. At 71 per cent, the positive rating is now ten percentage points below the 2009/10 figure of 81 per cent.
Introduction
5.1 Often a patient's first and only contact with the NHS is through their GP practice. It is vital, therefore, that every member of the public has ready and appropriate access to their local primary medical services to ensure better outcomes and experiences for patients. [10]
5.2 In recognition of the importance of providing appropriate access, a toolkit was developed in 2010 by the Royal College of General Practitioners ( RCGP) Scotland, the Scottish Government and other partners to help practices improve access to appointments, treatments and information and the Scottish Government made available to practices supporting material via the Productive General Practice website. [11]
5.3 A review of patient access to GP services across the country in partnership with the British Medical Association ( BMA) was also included in the GP contract agreement for 2014-15, in order to support practices and NHS Boards to both better understand the challenges and to make any necessary improvements to Access. [12] , [13]
GP practices - getting to see or speak to someone
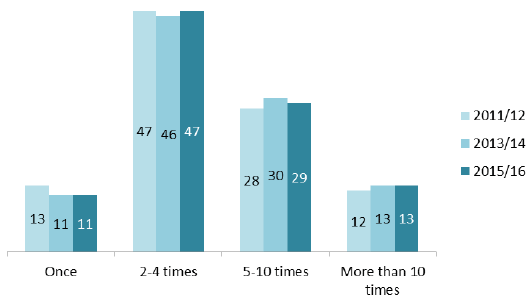
5.4 Ninety-one per cent of survey respondents had contacted their GP practice in the last 12 months. Of those people who could remember how many times they had contacted their GP practice:
- 58 per cent contacted it up to four times during the last 12 months;
- 42 per cent contacted it five or more times during the last 12 months.
5.5 These results are similar to the previous survey, which showed an increase in the percentage of patients contacting their GP practice 5 times or more from 2011/12 (Figure 1).
Figure 1: How often patients contacted their GP practice in the last 12 months (%)
Phoning the GP practice
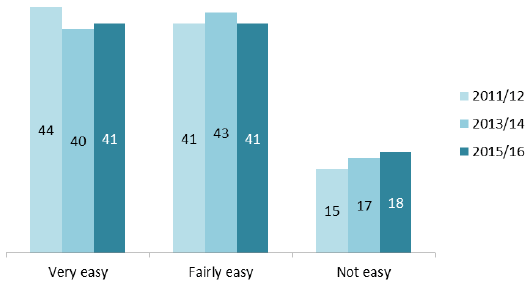
5.6 Patients were asked how easy it was for them to get through on the phone the last time they contacted their GP practice.
5.7 Of those patients who could remember their last experience of phoning the practice:
- 82 per cent responded positively (41 per cent responded very easy and 41 per cent fairly easy);
- 18 per cent responded they did not find it easy.
5.8 This is a one percentage point drop in positive responses from the previous survey and follows a further two percentage point drop since 2011/12. The results now suggest that one in six patients find it difficult to get through to their practice on the phone (Figure 2).
Figure 2: How easy was it to get through on the phone (%)
Helpfulness of staff on the phone
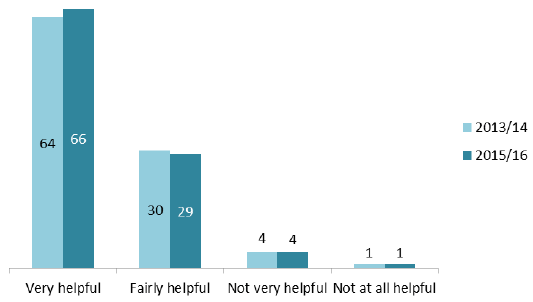
5.9 Patients were asked 'The last time you phoned the GP practice, how helpful was the person who answered?'.
5.10 Of the patients who remembered their last call, a very high percentage were positive about the person that answered the phone:
- 94 per cent found the person who answered very helpful or fairly helpful (66 per cent responded very helpful and 29 per cent fairly helpful);
- six per cent found the person was not very helpful or not at all helpful (Figure 3).
5.11 This is the same overall percentage of people responding positively as in the previous survey. Although within this, those responding 'very helpful' has increased from 64 per cent to 66 per cent.
Figure 3: How helpful was the person who answered the phone at the GP practice? (%)
Two working day access to see a doctor or a nurse
5.12 Each territorial NHS Board in Scotland is required to meet an LDP [14] standard that monitors the percentage of patients able to obtain access within two working days and to book an appointment in advance to an appropriate healthcare professional. GP practices are expected to provide reasonable and appropriate access for their patients as part of their services.
5.13 In the survey patients were asked how long they had to wait when they had needed to see or speak to a doctor or nurse from their GP surgery quite urgently.
5.14 Of those patients who needed to see or speak to a nurse/doctor and were able to remember:
- 84 per cent could see or speak to a doctor or nurse within two working days. This is not statistically different from the previous survey
5.15 Sixteen per cent were unable to see or speak to a doctor or nurse within two working days. Of these:
- 49 per cent said they had not been offered a chance to see or speak to anyone within two working days;
- 35 per cent reported that the person they wanted to see was not available in the next two days;
- 11 per cent reported that the times available were not suitable for them;
- six per cent were unable for another reason.
5.16 This is a higher percentage reporting that they were not offered any chance to see or speak to anyone than in the previous survey (49 per cent versus 46 per cent).
5.17 For the LDP standard patients are considered to have been able to obtain two working day access if they were offered an appointment, but turned the appointment down due to the person they wanted to see being unavailable or the time not suiting them.
5.18 Considering the results in this way, 91.8 per cent of patients were able to see or speak to a doctor or nurse within two working days, or were offered an appointment but either the person they wanted to see was unavailable or the time was not suitable. This is above the LDP standard of 90 per cent. However, it is also a modest drop from the previous survey (92.4 per cent). All but one NHS board met the 90 per cent standard [15] .
Booking an appointment in advance
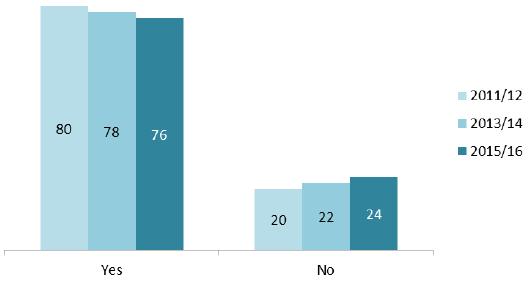
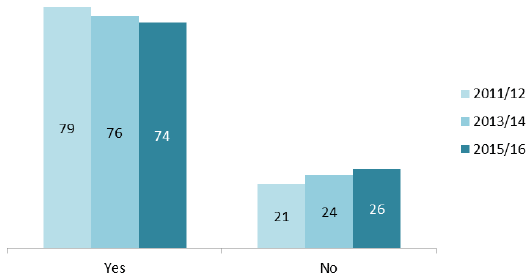
5.19 Patients were asked if their GP practice allowed them to make an appointment with a doctor three or more working days in advance. Almost a quarter of respondents (24 per cent) did not know whether this was the case or not.
Of those people who did know, 76 per cent responded that their GP practice allowed them to book an appointment three or more working days in advance. This is a decrease of two percentage points compared with the 2013/14 survey which was itself a drop of two percentage points from 2011/12 (Figure 4).
Figure 4: Does GP practice allow booking an appointment with a doctor 3 or more working days in advance? (%)
Ability to see preferred doctor
5.20 The survey asked patients if they usually saw the doctor they preferred when making an appointment.
5.21 For patients at GP practices where there is usually more than one doctor, 25 per cent of patients indicated that they do not have a preferred doctor.
5.22 Of the patients who have a preferred doctor, 74 per cent reported that they are usually able to see the doctor that they prefer. This is a two percentage point decrease from 2013/14 which itself had fallen three percentage points from 2011/12. In all the positive rating for this question has fallen six percentage points since 09/10 (Figure 5).
5.23 The ability of patients to see their preferred doctor is likely to be affected by the workforce of each individual practice. GP contractual arrangements are generally practice-based with an emphasis on patient care being provided by the whole clinical team.
Figure 5: Can patients see their preferred doctor at their GP practice? (%)
Opening hours of the GP practice
5.24 Since 2008 an enhanced service arrangement has been in place to extend GP surgery opening hours beyond core hours. Participation in enhanced services are optional for GP practices.
5.25 As part of the 2014/15 GP contract settlement the Scottish Government agreed to a review of GP access, the results of which were shared with patients and Health Boards in order that they could be used as the basis for discussion to make any necessary changes/improvements.
5.26 Patients were asked what they thought of the opening hours of their GP surgery.
- 80 per cent were happy with the opening hours;
- 11 per cent found it too difficult to get time away from work during opening hours;
- two per cent responded that the opening hours were not convenient for another reason;
- six per cent were not sure when their GP practice was open.
5.27 This is a two percentage point increase in those that were happy with the opening hours. Consistent with previous surveys, people who found practice opening hours inconvenient attributed this overwhelmingly to difficulty getting time away from work.
Overall arrangements to see a doctor or a nurse
5.28 Patients were asked to rate the overall arrangements for getting to see a doctor or a nurse in their GP practice.
5.29 71 per cent of patients rated the overall arrangements for getting to see a doctor positively ('excellent' or 'good') . This is a one percentage point drop from the previous survey and continues a downward trend, which has seen the positive rating drop ten percentage points since 2009/10 (Figure 6)
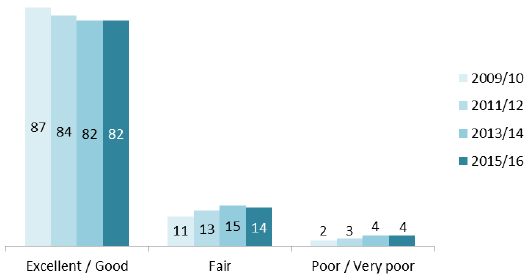
5.30 Eighty-two per cent of patients rated the overall arrangements for getting to see a nurse as excellent and good. This has remained steady from the previous survey having previously dropped from 84 per cent in 2011/12 and 87 per cent in 2009/10 (Figure 7). As in previous surveys, patients rated the overall arrangements for getting to see a nurse more positively than getting to see a doctor.
Figure 6: Overall arrangements for getting to see a doctor (%)
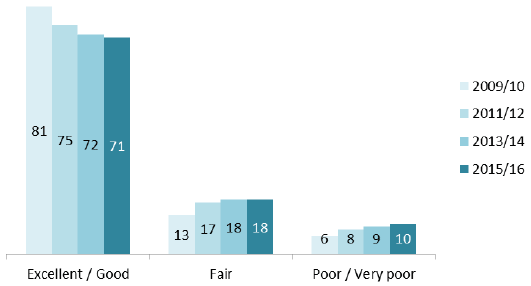
Figure 7: Overall arrangements for getting to see a nurse (%)
Contact
There is a problem
Thanks for your feedback