Homelessness in Scotland: 2016-2017
An overview of key trends and features of homelessness in Scotland from 2016 to 2017, as at 31 March 2017.
This document is part of a collection
Assessments
(Tables 11 to 16)
During the 2016-17 year, 82% of applicants (28,247 assessments out of a total of 34,267) were assessed as homeless or threatened with homelessness (Table 12). The proportion of applicants assessed as homeless/threatened with homelessness has gradually increased from 72% in 2004/05 and has remained above 80% since 2012/13.
There were 26,763 unintentionally homeless assessments during 2016/17, a reduction of 122 assessments on 2016/17 (a 0.5% reduction). These households are entitled to settled accommodation. [9] (Table 11c).
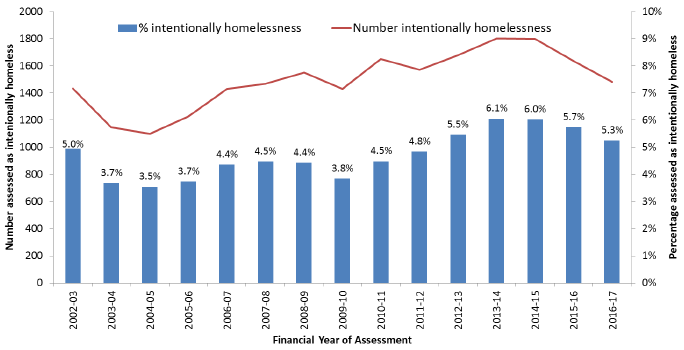
Chart 7 below shows that relatively few assessments are found to be intentionally homeless or threatened with homelessness, comprising 5.3% (or 1,484) of all assessments. However, this proportion has risen (from a low point of 3.5% in 2004/05).
Chart 7: Scotland: Intentionally homelessness assessment

The chart shows for each year the percentage of assessments where the applicant household was assessed as intentionally homeless or intentionally threatened with homelessness, as a proportion of those assessed as homeless or threatened with homelessness (and prior to 31st December 2012, the denominator was limited to those also in priority need).
Prior to the abolition of the priority need test, only those assessed as homeless (or threatened with homelessness) and in priority need would have proceeded to the intentionality test. However, following abolition, all those assessed as homeless (or threatened with homelessness) are tested for intentionality. As a result, more homeless applicants may be found to be intentionally homeless.
Repeat homelessness
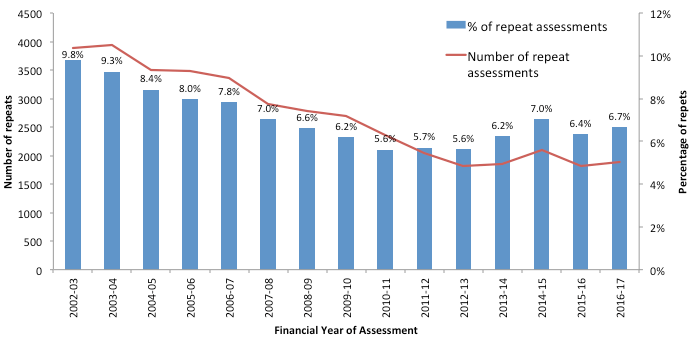
The percentage of homeless assessments identified as repeat cases (i.e. where a previous application from the household had been closed less than 12 months before the current assessment [10] ) fell from 9.8% in 2002-03 (3,892 assessments) to a low of 5.6% in 2010-11. It has since risen to 6.7% (1,885 assessments) in 2016-17 (See Chart 8 and Table 14).
The rate of repeat homelessness varies by Local Authority area, from around 12% in Dumfries and Galloway to around 1% in Eilean Siar (Table 14).
Chart 8: Scotland: Repeat homelessness assessments

The chart shows for each year the percentage of assessments where the applicant household was assessed as homeless or threatened with homelessness, had previously applied and been assessed as homeless or threatened with homelessness and whose previous application had been closed within 12 months of their current application.
Support needs of homeless households
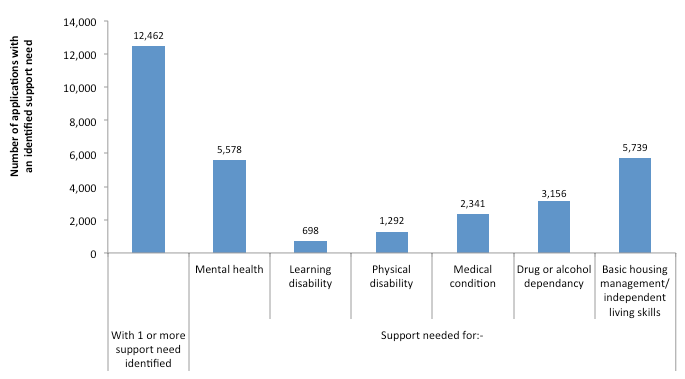
Of the 28,247 households assessed as homeless in 2016/17, 12,462 (44%) cited having one or more support needs. This proportion has increased by ten percentage points since 2012/13 (when this was 34%) (Table 15).
During 2016/17, around a half of applicants with support needs cited support needs for basic housing management/ independent living reasons (46% of those with support needs or 5,739 times indicated). 45% specified a mental health problem as a support need (indicated 5,578 times) and 25% cited drug or alcohol dependency (See Chart 9).
When considering that repeat homelessness applications have risen since 2012/13, the increase in support needs identified in applications may indicate a more complex situation. That is, whilst Housing Options may be tackling more straightforward cases, a minority of households may have more complex needs than was previously the case.
Chart 9: Identified Support Needs of Homeless Households Scotland 2016-17

Contact
There is a problem
Thanks for your feedback