Key Scottish Environment Statistics 2016
Reference document offering information on a wide range of environmental topics, covering key datasets.
This document is part of a collection
Background
Many of the environmental measures that are reported in Key Scottish Environment Statistics are affected by similar background drivers. These generally correlate with the usage of resources and the release of pollutants in the natural world. In many cases as these drivers increase, they lead to the worsening of a wide range of negative effects on the environment. In order to put the rest of the environmental statistics into context, these drivers have to be accurately measured.

The process for responding to environmental issues can be informed by the DPSIR (Drivers, Pressures, State, Impact, Responses) model [1] . Under this model, the pressures that directly affect the state of the environment are envisioned as being directly affected by drivers. These can be affected by responses from the government to try and improve the state of the environment, or mitigate the impact of the pressures. This chapter gives information on datasets that are often thought to be important drivers of environmental pressures.
For instance, the Gross Domestic Product ( GDP) of a nation is fundamentally a measure of economic activity. Economic activity will generally drive the use of energy and other resources, leading to pressure on the environment from carbon dioxide emissions, waste and pollution, and ultimately impacting in terms of climate change. In order to ensure the long-term sustainability of both the economy and the environment, Scotland needs to achieve economic growth without environmental degradation.
In order to maintain economic growth without causing additional environmental damage it is necessary to "decouple" the correlation between GDP and carbon dioxide emissions and other negative environmental effects. Many environmental policies are geared towards this goal, such as zero waste, circular economy, and renewable energies.
Targets and Aims
- 2017: Match the GDP growth rates of small independent EU countries
- 2017: Match average European ( EU15) population growth rate in the period from 2007
- 2020: Renewable electricity generation to be the equivalent of 100% of gross electricity consumption
Population and Households: 1991-2039 R
Population/Households (thousands) [2]

Why this measure is important
People and households are important consumers of energy and water, therefore the population and number of households will have an effect on the wider environment.
Background
Population estimates [3] are rebased with each census to ensure a consistent time series. Household estimates [4] for 2002 onwards are based on the number of occupied dwellings from council tax billing information.
Trend
The population of Scotland declined steadily through most of the 1980s, followed by small increases in the seven years up to 1995. The population subsequently decreased to a low of 5.06 million in 2000 before increasing to 5.37 million in 2015. The latest projections [5] indicate that the population will rise by 6.1% to 5.70 million in 2039. This trend is consistent with the overall UK population, which is also projected to increase but at a greater rate.
The number of households rose by 391,150 (19%) between 1991 and 2015. Projections [6] based on 2012 figures suggest that the number of households in Scotland will increase by 14% between 2015 and 2037, to 2.78 million.
Factors affecting trend
Changes in population can be due to changes in the numbers of births and deaths and migration. Since mid-2000, the population increase has mostly been due to net migration, as more people came to Scotland than left [7] . Growth in households has been faster than the population because more people are living alone and in smaller households.
Source: National Records of Scotland
Metadata - Population/ Households
Gross Domestic Product ( GDP) [8] : 1998-2015 R
Scottish GDP at basic prices (2013=100)
: 1998-2015R")
Why this measure is important
Scotland's Gross Domestic Product ( GDP) is the main indicator of Scotland's economic performance. The GDP index is a short-term measure of output growth, adjusted for inflation. Traditionally, growth in GDP has been linked with environmental problems such as increased carbon dioxide emissions, waste and pollution.
Background
The GDP index is produced in constant (2013) prices, meaning that the effect of price changes is removed from the estimates, and is seasonally adjusted. These estimates measure GDP at basic prices, also referred to as Gross Value Added ( GVA), which does not account for taxes or subsidies on products.
Trend
Over the 2015 calendar year, GDP in Scotland grew by 2.1%. This followed growth of 2.6% during 2014. Over the period 1998 to 2015, the Scottish GDP index increased by 29%, from 81.2 in 1998 to 104.7 in 2015.
Factors affecting trend
Scottish GDP can be affected by a number of factors, including overall economic conditions. This can be seen in the decrease in Scottish GDP of 2% between 2008 and 2009, following the deterioration in global economic conditions.
Source: Scottish Government
Metadata
Motor Traffic on All Roads: 1993-2015 R
Million vehicle kilometres

Why this measure is important
The pollutants emitted by road transport are a major contributor to poor air quality, which damages human and ecosystem health [9] . Fine particulate matter and nitrogen dioxide are the pollutants of most concern, due primarily to their effects on human health. Transport emissions also contain carbon dioxide and other greenhouse gases, which contribute to climate change.
Background
Data are provided by the Department for Transport as part of a UK wide survey.
Trend
During the period 2007-2011 there was a reduction in motorised road traffic; however, from 2012, levels have shown an upward turn reaching the highest level ever in 2015.
Compared with 1993, motor traffic on all roads was 29% higher in 2015, with increases of 44% for two-wheeled motor vehicles and 94% for light goods vehicles. Cars now account for 77% of motorised road traffic.
Factors affecting trend
There are a number of factors that may contribute to increases in motor vehicle traffic [10] . There were increases in the number of householders with access to at least one car for private use until around 2007, and this number has since remained fairly steady at about 70% of households in Scotland [11] . 2015 saw the most registrations of new vehicles in Scotland in a single year since 2007 [12] and the total number of light goods vehicles registered is now at the highest level in at least the last 10 years.
Source: Department for Transport
Metadata
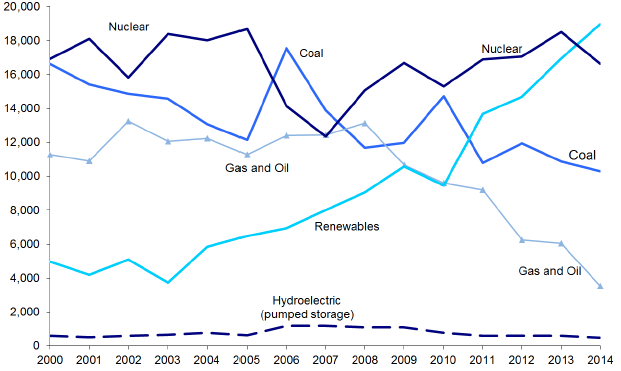
Electricity Generation by Source: 2000-2014 R
Electricity generated (GigaWatt hours) [13,14]
Why this measure is important
The combustion of fossil fuels, especially coal, is a major contributor to carbon dioxide emissions, which is one of the six greenhouse gases that Scotland is committed to reducing under the Climate Change (Scotland) Act 2009. [15]
Background
Data are obtained from the Department for Business, Energy and Industrial Strategy.
Trend
In 2014, Scotland generated 49,929 GWh of electricity, 5.7% less than in 2013. Of this total, 18,962 GWh (38%) was generated from renewable sources [16] , which is an increase of 11.9% from 2013. Electricity generated from renewable sources equated to almost 50% of the gross consumption [17] of electricity in Scotland in 2014, compared with 44% in 2013. Fossil fuels accounted for 28% of Scotland's electricity generation in 2014, compared with 32% in 2013, while 33% of the electricity generated in 2014 was from nuclear power stations, compared with 35% in 2013.
Factors affecting trend
Fossil fuel generation in Scotland tends to vary over time and is influenced by a wide range of factors including fossil fuel prices (absolute and relative) and the prevalence of renewable and nuclear generation. The closure of Cockenzie Power Station in March 2013 has also contributed to the reduction in electricity generated by fossil fuels. Generation of renewable electricity from non-hydro sources has grown year on year since 2000. Building upon a long established base of hydro generation, the recent growth in renewable capacity has been predominantly through onshore wind.
Source: Department of Business, Energy and Industrial Strategy/ Scottish Government
Metadata
Contact
There is a problem
Thanks for your feedback