A new definition of fuel poverty in Scotland: review of recent evidence
A report by a panel of independent experts who conducted a review of the definition of fuel poverty in Scotland.
Chapter 8 Demographic and Geographic Profiles
8.1 Introduction
This Chapter provides a concise review of the patterns of incidence of fuel poverty under different proposed definitions, in comparison with the existing definition. It looks at the pattern across different population age and household composition groups, housing tenure, type, age and occupancy categories, as well as the pattern in terms of features particularly associated with fuel poverty, namely general poverty and the energy efficiency rating of homes. The Chapter also looks at the potential impact of changed definition on the incidence across urban and rural areas, in particular the more remote rural areas.
It is important to be aware of these patterns, and that any new definition of fuel poverty may affect different groups in different ways, in terms of inclusion or exclusion. The panel did not think that it was appropriate to choose a fuel poverty definition primarily on the basis of some predetermined demographic or geographic profile. Rather, our approach has been to focus primarily on outcomes, in terms of the association of fuel poverty under different definitions with a range of adverse outcomes. Nevertheless, any recommendation and decision should be informed by a full set of information including evidence concerning potential impacts on different groups of concern to different stakeholders. This may have a bearing on policy programme design issues going beyond the definition of fuel poverty itself.
The profile comparisons are mainly compared using bar charts showing the proportion of households in each group who would be deemed 'fuel poor' under each definition. This overcomes the issue that different groups represent very different shares of the overall population, although sometimes when salient we also mention the share of fuel poor within particular categories.
8.2 Demographic profile
8.2.1. Prevalence of fuel poverty
Table 8.1. shows prevalence rates using different options, (preferred option highlighted).
- the (traditional) 'Boardman' definition estimates a 2015 prevalence rate for Scotland of 30.7%;
- the Panel's recommended option (is MIS2 i.e. 'residual income after housing and fuel costs below 90% of MIS level, with fuel costs over 10% of AHC income, using the new preferred temperature regime associated with the modified vulnerability definition';
- the estimated prevalence rate for Scotland under MIS2 is 31.9%;.
- this increase of 1.2% over the current Boardman definition equates to approximately 30,000 more households.
The modified Boardman approach, the Hills LIHC definition and the modified version of LIHC all have lower overall prevalence, and in that sense may be seen as more restrictive definitions. Three variant sets of parameters are tested around the recommended MIS 90/10 NTR definition. One of these (95/10 NTR) is more generous, by setting a higher percentage of the full MIS, and this has a similar incidence to the Boardman + NTR at 33.0%. The other variants are slight more restrictive, with MIS 90/12 NTR entailing a higher fuel cost as percentage of AHC income and bringing the incidence down to 27.6%. The further option of 85/12 NTR brings it down a little further, to 26.2%.
Table 8.1.: Fuel Poverty rates (2015). ( SHCS and SHS data) using current* ( CTR) and modified temperature regimes ( NTR)**
| Definition | Description | Fuel Poverty CTR | Fuel Poverty NTR |
|---|---|---|---|
| Current Boardman | 10% net income BHC | 30.7% | 33.0% |
| Modified Boardman | 10% AHC and <60% med AHC | 19.3% | |
| LIHC | <60% med AHFC & FC > med FC | 12.3% | |
| Modified LIHC | <60% med AHFC & FC>10% AHC | 24.2% | |
| MIS 1 + | <90% MIS AHFC | 38.1% | |
| MIS 2 (90/10) + | <90% MIS AHFC & FC>10% AHC | 30.3% | |
| MIS 2 (90/10) * | <90% MIS AHFC & FC>10% AHC | 30.7% | 31.9% |
| MIS 2 (95/10) * | <95% MIS AHFC & FC>10% AHC | 31.9% | 33.0% |
| MIS 2 (90/12) * | <90% MIS AHFC & FC>12% AHC | 25.7% | 27.6% |
| MIS 2 (85/12) * | <85% MIS AHFC & FC>12% AHC | 24.5% | 26.2% |
| MIS 2 (85/15) * | <85% MIS AHFC & FC>15% AHC | 18.8% | 20.2% |
+ Incorporates disability adjustment of +83 £/week to MIS thresholds (no remote rural enhancement).
* Remote Rural Adjustment to MIS (As Well As The Disability Adjustment). These MIS measures include an adjustment to MIS thresholds for households HHs) in remote rural areas (working age singles and couples +15% of MIS, pensioner singles and couples +19%, and HHs with children +27.5%).
** New Heating Regime ( NTR) . Fuel poverty rates in this column are based on the modified heating regime. This consists of 3 degree difference - i.e. 23 degrees in the living rooms and 20 instead of 18 degrees in other rooms - for vulnerable HHs, where these are defined as those with any member who is LTSD, or any member aged 75 or above, or any children aged 4 or under. In the case of the latter ( HHs with pre-school children), for which the necessary BREDEM energy consumption variable is not currently available, a 20% increase was applied to energy consumption, on the basis that vulnerable households are modelled as requiring on average 20% more energy than other households, under the 20/23 heating regime (this is around 10% under the 18/23 regime).
Source: Scottish House Condition Survey (2013-2015).
8.2.2. Fuel poverty by definition and household composition
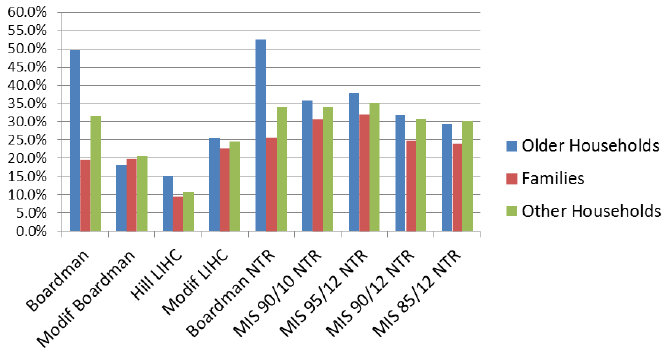
Figure 8.1 presents a summary picture using the different options for definition.
Figure 8.1.: Fuel poverty rates by definition and broad household types
Source: Scottish House Condition Survey (2013-2015)
The classic Boardman definition is distinguished by giving a much higher FP incidence to older households, particularly compared with families but also with other household types. No other approach tested gives anything like such a high incidence to older households, although it should be noted that the MIS based approaches still give slightly higher incidence to older households. Modified Boardman actually gives older households the lowest rate, a finding confirmed in the PSE dataset, while modified LIHC only gives a slight premium to older households. The PSE data also indicate that a material deprivation based indicator would also give a very low incidence to older households.
All approaches give families the lowest incidence, with MIS 90/10 and 95/12 giving them a relatively higher score, but it should be noted that under all approaches lone parent families have much higher incidence, while under a number of approaches (especially MIS) larger families (3+ children) would have a higher incidence. It should also be underlined that single person households of working age tend to have a higher incidence under most approaches than multi-adult and family households.
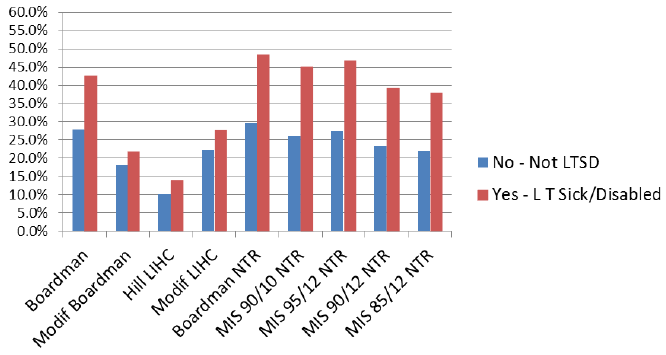
8.2.3. Fuel poverty and long term illness or disability ( LLTID)
This is illustrated in Figure 8.2. Here we find a convergence between traditional Boardman and the MIS-based approaches, where both give a much higher incidence for households with LLTID. This is partly because of the enhanced temperature regime but also because of the substantial disability enhancement to the MIS allowances for other living costs. The other alternatives (modified Boardman, LIHC and modified LIHC) do not have this characteristic, giving relatively little greater chance of being classified as fuel poor to households with LLTID.
Figure 8.2.: Fuel poverty by definition and long term illness/disability status
Source: Scottish House Condition Survey (2013-2015)
8.2.4. Housing tenure
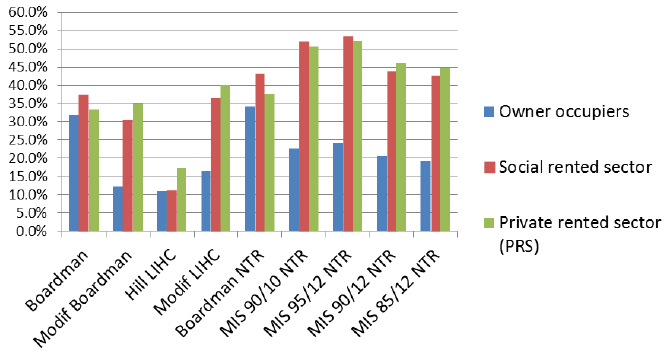
Housing tenure shows a marked difference between the approaches to defining fuel poverty (see Figure 8.3). Under classic Boardman, owner occupiers have almost as high an incidence of FP as the rental tenures. This changes under virtually all of the alternatives (except Hills), which show renters having FP rates double or more that of owner occupiers. This reflects the general societal trend whereby older households have seen their poverty rates fall and relative living standards rise strongly since the 1990s, and is particularly influenced by the shift of focus in poverty from Before to After Housing Cost measurement.
Figure 8.3.: Fuel poverty by definition and by housing tenure
Source: Scottish House Condition Survey (2013-2015)
Among the variant MIS based approaches, as well as modified Hills or Boardman, there is less difference, but not complete agreement as to whether social renters or private renters have higher rates of FP. In our preferred recommended definition, the two rates are very similar.
8.2.5. Housing type
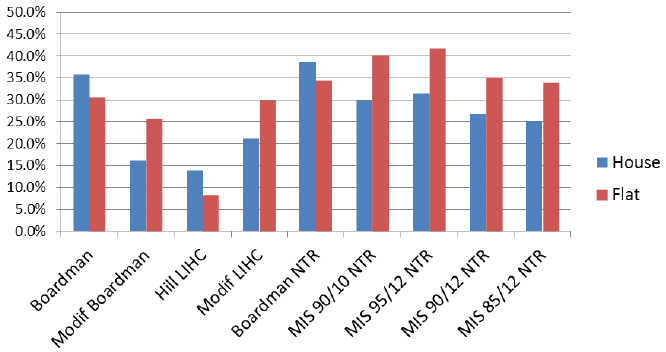
Figure 8.4 looks at broad house type. Here we see a shift from a higher rate in houses under traditional Boardman to a higher rate in flats under most of the alternatives, except Hills LIHC. While flats have some intrinsic advantages in terms of energy efficiency, people living in flats are much more likely to be poor.
Figure 8.4.: Fuel poverty by definition and housing type
Source: Scottish House Condition Survey (2013-2015)
8.2.6. Underoccupancy
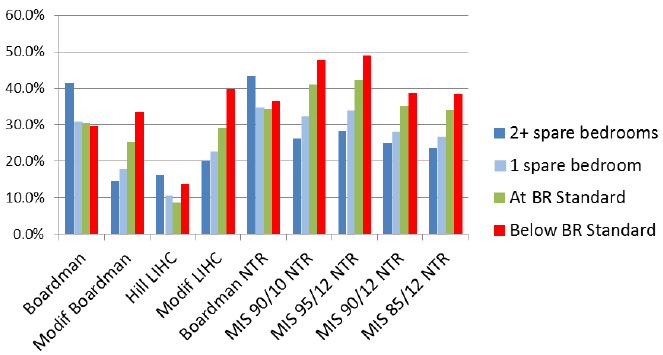
The next figure shows a similar picture, this time focused on bedroom occupancy.
Figure 8.5.: Fuel poverty by definition and bedroom occupancy
Source: Scottish House Condition Survey (2013-2015)
The Boardman based indicators show relatively high scores for households with two or more spare bedrooms - one may infer that many of these will be older households in owner occupation. Most of the alternatives, certainly those based on MIS or the modified versions of LIHC and Boardman, show a pattern where overcrowded households are most likely to be fuel poor and underoccupying households least likely. While we have not recommended imposing an occupancy limit on fuel poverty, it is reassuring to see that there is an inverse relationship with underoccupancy.
8.2.7. Age of dwellings
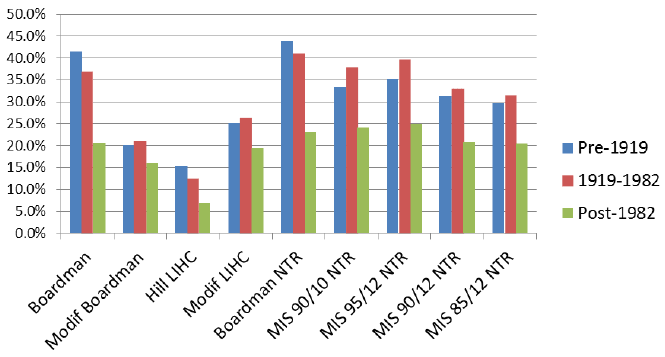
While clearly there is some relationship between type and size of housing and required fuel costs, particular features of dwellings are known to have a strong relationship. One of these is age of dwelling, with greater problems associated with pre- WW1 stock and energy insulation standards generally higher on post-1980 housing. Figure 8.6 shows that fuel poverty is more associated with older housing, with the critical cutoff being 1980 rather than 1919.
Figure 8.6.: Fuel poverty by definition and age of housing
Source: Scottish House Condition Survey (2013-2015)
All FP definitions show this pattern, but it is more strongly marked in the Classic Boardman and MIS-based measures, and less so in modified Boardman or LIHC. This is one case where the difference between Boardman and MIS (90/10) is not that marked.
8.2.8. Energy efficiency of dwellings
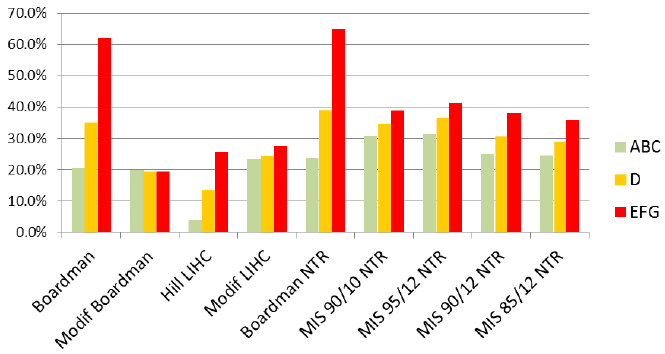
This is the focus of Figure 8.7, where the stock is divided into three groupings - ABC, the relatively efficient grouping, D which is intermediate, and EFG which are the least energy efficient. As expected, fuel poverty is generally worse in EFG rated homes than in ABC rated, although curiously this does not appear to be the case with Modified Boardman, and the relationship is weak with Modified LIHC. Classic Boardman shows the strongest difference, with the MIS -based measures all showing a more moderate pattern in the expected direction.
Figure 8.7.: Fuel poverty by definition and energy rating of home
Source: Scottish House Condition Survey (2013-2015)
The fact that between 25% and 31% of households living in ABC rated homes are still in fuel poverty (or that as many as 36% of fuel poor live in such homes) is indicative of the fact that there are many poor households, particularly in social renting, who struggle to maintain or pay for adequate thermal comfort, primarily because of their poverty. Although social landlords have improved the average quality of their stock, this is not generally to the point of eliminating fuel bills as an issue. While further efforts in this direction may be part of the solution to fuel poverty problems on the ground, this finding underlines that part of the response should perhaps be directed more towards increasing these households' income. In other words, these analyses support the view that, for some low income households, any energy bill, even one consisting of only standing charges, will present them with a substantial financial burden.
8.2.9. Urban-Rural differences
It is clear from the literature and debate about fuel poverty, particularly in Scotland, that this is perceived to be an issue with a particular salience in rural areas, and perhaps especially in the more remote and sparse rural environments which are a particular feature in Scotland. Fuel costs can be markedly higher due to such factors as not being connected to the gas grid and reliance upon oil, bottled gas or solid fuels; this may be compounded by characteristics of the housing stock and by features of rural poverty (e.g. prevalence of low, seasonal or insecure work incomes). As discussed in Chapter 4, it can also be argued that the way fuel costs are measured in the Scottish Government ( SG) modelling may understate the actual price paid by some rural residents, although in the exemplifications here we are reliant upon the standard SG model. There may be scope to look further at 'actual' fuel spend data and at material deprivations associated with FP across the urban-rural spectrum, particularly in the near future when SG are intending to collect some metered consumption data for the SHCS sample.
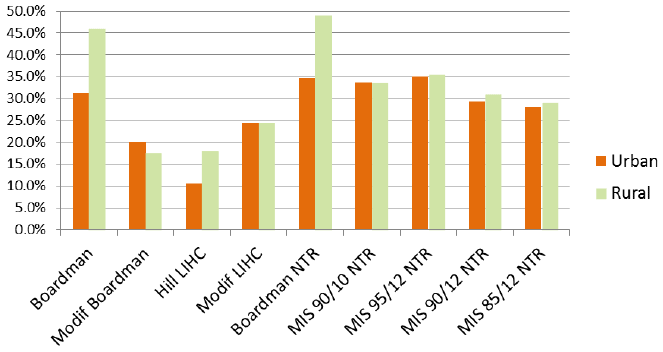
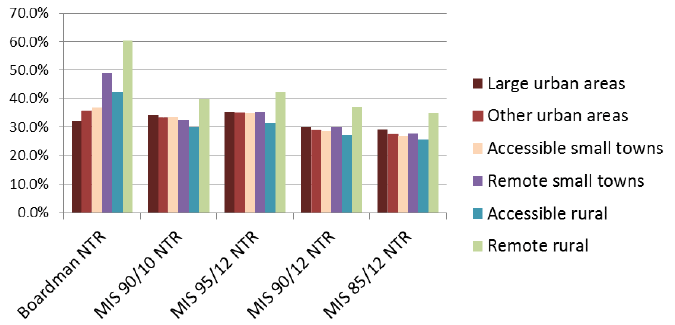
With these qualifications in mind, we look in Figures 8.8 and 8.9 at the pattern of fuel poverty under different definitions across the urban-rural classifications, a simple 2-way division and a more detailed 6-category division. Figure 8.8 suggests that fuel poverty is substantially higher in rural Scotland if you use the classic Boardman definition, but that the differences become much smaller if you use any of the alternative definitions. Mostly, these still show slightly higher or similar levels of fuel poverty in rural Scotland to the urban levels, although one exception is the 'modified Boardman' measure which shows lower rates in rural compared with urban areas. The sharpness of this switch suggests that both the shift to after housing costs and the cutting off of fuel poverty eligibility from households who are not poor, or close to the poverty line, have a big effect on the outcome. In other words, classic Boardman highlights households who are not poor, perhaps because they are older outright owners, but who have expensive to heat houses. With the MIS-based measures, we recognise not just the higher fuel costs (as modelled) but also some other higher living costs (e.g. motoring), in more remote/deep rural locations, based on the 2013 HIDB Cost of Living study. These are offsetting other factors which make for less poverty in rural areas, for example lower rates of worklessness and lower housing costs.
Figure 8.8.: Fuel poverty by definition and by 2-way urban-rural division
Source: Scottish House Condition Survey (2013-2015)
Figure 8.9 provides a comparison of a more limited set of fuel poverty measures across a more detailed classification of the urban-rural continuum. All measures illustrated seem to show that remote rural areas do have markedly more fuel poverty than all other area types, to that extent confirming the a priori arguments and the case made by rural stakeholders. While the difference is greater under 'classic Boardman', it is still marked in all the MIS-based measures, although somewhat more in some than in others.
It is slightly less clear what the pecking order is between the other types of area. Boardman suggests remote small towns, and to a lesser extent accessible rural, also have higher incidence. The MIS measures suggest that accessible rural generally has a low incidence, below the urban categories. Two of the MIS measures give slight support to the notion that remote small towns also have a slightly higher incidence.
Figure 8.9.: Fuel Poverty by definition and more detailed urban-rural classification
Source: Scottish House Condition Survey (2013-2015)
Using a different dataset (the Poverty and Social Exclusion Survey) we also found that our preferred measure ( MIS 90/10 NTR) showed markedly higher incidence in remote and sparse rural areas, but that accessible rural, small town and urban fringe areas tended to show lower fuel poverty than larger urban areas. This dataset also enables testing of a material deprivation ( MD) based fuel poverty definition. However, this shows a markedly lower level of incidence in the deep rural areas.
8.3 Poverty Overlap
An important part of the critique of the existing fuel poverty measure, as voiced for example through the SWG report, is that it is insufficiently related to poverty. It is therefore appropriate to report on the degree of overlap between fuel poverty and general poverty. There are of course different ways of measuring poverty, and some of our fuel poverty indicators are more closely related to one rather than another measure, so that we may expect close relationships in particular cases, but not in others.
Table 8.2 provides a summary of these relationships. Classic Boardman is less closely related to poverty than modified Boardman, which is particularly closely related to AHC poverty. Both variants of LIHC are quite closely related to AHC poverty. The recommended MIS 2 (90/10) is quite closely related to poverty based on MIS, although rather more of the non-fuel poor are income poor here.
Table 8.2.: Fuel poverty ( FP) and relative income poverty ( IP) under different definitions of fuel poverty and general poverty ( SHCS, 2015).
| Definition | % FP and IP | % IP not FP | % FP and IP | % IP not FP | % FP and IP | % IP not FP |
|---|---|---|---|---|---|---|
| Poverty Basis | BHC | BHC | AHC | AHC | MIS | MIS |
| Current Boardman | 47% | 5% | 50% | 10% | 74% | 26% |
| Modified Boardman | 76% | 4% | 100% | 4% | 99% | 27% |
| LIHC | 61% | 12% | 77% | 15% | 96% | 34% |
| Modified LIHC | 66% | 3% | 84% | 3% | 98% | 23% |
| MIS 1 | 47% | 1% | 58% | 1% | 99% | 6% |
| MIS 2 (90/10) | 55% | 2% | 66% | 4% | 99% | 16% |
| MIS 2 (90/10) | 52% | 2% | 64% | 3% | 98% | 15% |
Using a different dataset and expressing it slightly differently, the PSE survey analysis suggests that 68% of the general poor ( AHC [31] ) would be fuel poor under classic Boardman, but this would rise to 83% under modified Boardman, 92% under modified LIHC, and 95% under MIS 90/10. Using a different poverty definition, based on material deprivation as well as income, these figures would all be lower, 46%, 55%, 64% and 70% respectively - this perhaps underlines the limitations of poverty measures based solely on current income.
8.4 Additional Severity Measures
The analysis so far has concentrated on seeking a single, binary fuel poverty indicator, as a key national target and by implication as a basis for targeting programmes and actions. We are conscious that existing indicators actually include more than one measure, such as the severity bands within Boardman or the 'gap' measure within LIHC. We have given only limited consideration to this issue. A measure of the size of the gap between the household's actual fuel bill and the fuel bill which it could just afford, on our preferred FP definition ( MIS 90/10), based on PSE analysis for UK in 2012, is illustrated in Table 8.3. The figures are based only on those in fuel poverty. The median value of this gap is £585 per year. Larger values are shown for bigger family households, for owners and private renters, for houses rather than flats, and for rural areas, especially the remote and sparse rural locations.
Clearly, this kind of measure could be turned into a banded or categorical measure e.g. households with a Gap > £650 etc. In this way, bands of severity could be introduced. For household types, a median Gap > £65 is present among households of 2 adults, multiple adults, and elderly couples. The last-mentioned have a particularly high Gap (£964), suggesting that - whilst this group is less prominent in prevalence figures under the preferred MIS9010 definition than under Boardman - some of them may nevertheless be experiencing among the most severe levels of fuel poverty. These patterns by household type arise partly because larger households tend to require larger absolute fuel costs - while in theory there is a case for 'equivalising' fuel costs in this context, this is a complication which we have tried to avoid up to this point.
The same pattern emerges among owner-occupiers, where the gap is high (£751) even though this group features less prominently in terms of overall fuel poverty prevalence under the MIS9010 option. However, private renters are both more prominent under MIS9010 than Boardman and have the largest Gap by tenure group (£793).
The extent to which fuel poverty in remote rural areas of Scotland is more severe than any other area is made plain by the fact that the median Gap in these remoter regions is almost double that in accessible areas.
Table 8.3.: MIS9010 'Gap' measure for fuel poor households by demographic/geographic categories ( SHCS, 2015).
| Mean gap | Median gap | No. of Fuel Poor HH's | Sample size (Fuel Poor HH's) | |
|---|---|---|---|---|
| Single non elderly | £784 | £617 | 172,000 | 182 |
| Lone parent | £749 | £545 | 53,000 | 69 |
| Couple /2 adults | £858 | £669 | 126,000 | 126 |
| Cpl + 1 child | £960 | £554 | 48,000 | 48 |
| Cpl + 2+ children | £1,097 | £631 | 49,000 | 56 |
| Multi Adult | £1,093 | £740 | 109,000 | 116 |
| Single elderly | £845 | £622 | 148,000 | 177 |
| Couple elderly | £1,064 | £964 | 71,000 | 82 |
| Owner Occupier | £1,093 | £751 | 327,000 | 375 |
| Social Rented | £662 | £502 | 290,000 | 317 |
| Private Rented | £982 | £793 | 150,000 | 155 |
| House | £1,093 | £776 | 449,000 | 551 |
| Flat | £648 | £513 | 328,000 | 305 |
| Large urban areas | £768 | £631 | 255,000 | 212 |
| Other urban areas | £768 | £562 | 306,000 | 325 |
| Accessible small towns | £971 | £702 | 72,000 | 84 |
| Remote small towns | £1,546 | £1,188 | 28,000 | 61 |
| Accessible rural | £1,121 | £651 | 62,000 | 76 |
| Remote rural | £1,672 | £1,314 | 53,000 | 98 |
| Scotland | £905 | £646 | 777,000 | 856 |
Note: Tenure groups do not include Rent free households (9 survey cases).
Estimates based on modified heating regime (20 degrees in Zone 2 for vulnerable households, and vulnerable households including those with children under 5, members aged 75+, or members who are long-term sick or disabled) as well as based on MIS thresholds incorporating disability adjustment and remote rural enhancement.
It is clear that the inclusion of data on the geography and demography of the Gap provides a valuable supplement to prevalence data.
8.5 Conclusions
We underlined at the outset that the key evidence to use in deciding on the best definition of fuel poverty should be evidence about adverse outcomes. The picture in terms of how different definitions impact on different demographic and geographic groupings is a useful part of the overall picture, and necessary to inform future policy design, but should arguably not dictate the fuel poverty definition. Another consideration will inevitably be the overall percentage rate of fuel poverty, and here it is helpful to be able to compare the existing and recommended definitions. They have a broadly similar overall incidence: 30.7% under the current Boardman definition, and 31.9% under the Panel's preferred MIS2 definition (which encompasses a modified heating regime and markups associated with disability and rural location).
Following our recommended definition would lead to a significant shift in some aspects of the demographic profile, including a reduced emphasis on older households (relative to families), a reduced emphasis on home owners (relative to tenants), on houses (as against flats) and on larger underoccupied houses. In all these cases, however, the same pattern of change would follow whichever of the alternative fuel poverty measures were chosen. At the same time, certain important features of the profile would be maintained: long term sick and disabled would still be much more likely to feature, as would older (pre-1980) housing, and housing with a lower energy efficiency rating would still have a higher chance of being identified, although this relationship would be less strong. Our analysis suggests that once different types of rural areas are distinguished, our recommended approach would still show markedly higher levels of fuel poverty in the most remote/sparse rural areas. And of course, by design, fuel poverty would show a stronger relationship with poverty more generally.
Key Conclusions on demographic and geographic profiles
Any decision on who is included or excluded from being classified as in fuel poverty may need to be informed by additional evidence concerning potential impacts on different groups of concern to different stakeholders. This may have a bearing on policy programme design issues going beyond the definition of fuel poverty itself.
Adopting a Minimum Income Standard approach to how fuel poverty is defined has consequences for the demographic and geographic profile of where fuel poverty is most likely to be found.
However, adopting a Minimum Income Standard approach does not alter the prevalence rate of fuel poverty when this is compared with the rate derived from a classic Boardman definition. Under both Boardman and our preferred MIS2 option, approximately one-third of all Scottish households are experiencing fuel poverty.
As with most conventional definitions of fuel poverty which rely on after housing cost calculations, prevalence shifts away from older owner occupiers, and towards younger people, particularly lone parents, and private renters.
Both the preferred approach and the Boardman option yield a high prevalence among households where someone is living with a long term illness or disability.
Under a definition guided by Minimum Income Standards, people living in very energy efficient homes ( SAPs of A to C) can often be classified as fuel poor, given the extent to which even the most basic energy bill (based on standing charges) constitutes a significant financial burden.
Fuel poverty is substantially higher in rural Scotland under Boardman, but differences are smaller using any of the alternative definitions. Higher fuel costs and higher living costs in rural areas are offset by lower housing costs and lower rates of worklessness. However, all options suggest that remote rural areas have markedly higher rates of fuel poverty than other areas.
The preferred option can be used to generate a severity metric, akin to that of the LIHC's gap. This, in turn, could be used to generate severity bands, akin to those used in Boardman. Publication of data on the demography and geography of the gap is likely to be an essential supplement to prevalence data, indicating where and for whom fuel poverty is at its most extreme.
Contact
There is a problem
Thanks for your feedback