Planning performance statistics: first quarter, 2017-2018
The latest statistics on planning application decision-making and timescales for quarter 1 of 2017 and data going back to quarter one of 2013-2014.
3. Major Developments
Major developments include applications for developments of 50 or more homes, as well as other applications covering areas of development such as minerals, housing, business & industry, waste management, electricity generation, freshwater fish farming, marine finfish farming, marine shellfish farming and other developments. Classification between local and major developments depends on the particular development type. For example, housing developments are classed as major when the application is for 50 or more dwellings or for a site that exceeds two hectares, whereas electricity generation is classed as major when the capacity of the generating station is or exceeds 20 megawatts.
Details for the classification of all development types can be found here: http://www.gov.scot/Resource/Doc/278390/0083657.pdf.
This section presents quarterly information on average timescales across all major developments, along with separate figures for the key categories of housing, business and industry and other developments. Information on other more detailed categories of major developments is reported on an annual rather than quarterly basis.
Figures for all applications, which include legacy cases validated before 3 rd August 2009, are shown up to the end of 2016/17. From quarter one 2017/18, because of the limited number of legacy cases still being processed, figures are only shown for applications validated post August 2009.
3.1. All Major Developments
For applications subject to average time calculations there were 55 major developments decided in quarter one of 2017/18, 9 (14 per cent) fewer than the 64 decisions in the previous quarter, and 6 (9 per cent) fewer than the 61 decisions in the equivalent quarter of 2016/17. The average decision time for these 55 major developments was 39.8 weeks, more than seven weeks slower than the previous quarter (32.6 weeks) and slower by four days compared to the equivalent quarter one figure in 2016/17 (39.3 weeks) ( Quarter 1, 2017/18 – Table 2).
Chart 23: All Major Developments: Number of decisions
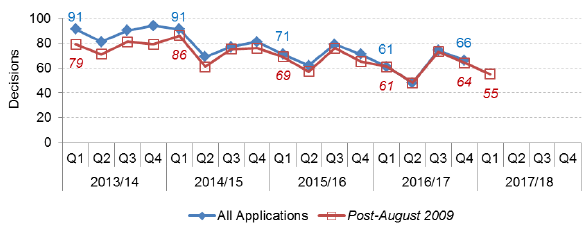
Chart 24: All Major Developments: Average decision time (weeks)
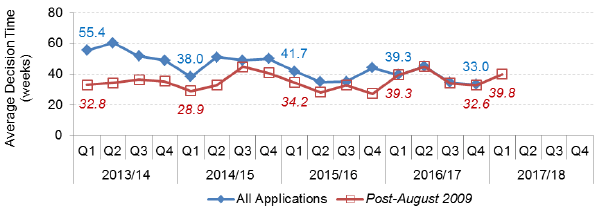
The average decision time figure of 39.8 weeks has been influenced by a number of lengthier times including five that each took longer than two years. More than 72 per cent of the 55 major development applications were decided in a time that was quicker than the average. Further information on the distribution of decision times for major development applications is given in Annex A.
There were a further 26 major development applications concluded in quarter one of 2017/18 that were subject to separate processing agreements. 69.2 per cent of these applications met agreed timescales that had been set between developers and local authorities. Applications subject to processing agreements are not included in average time calculations. For the most recent quarter, major applications with processing agreements accounted for more than a quarter of the decisions made for all major developments.
The time taken to make decisions on major applications can vary greatly between planning authorities and the individual application so average figures based on a small number of applications can be volatile.
In quarter one of 2017/18 Glasgow City made the most decisions on major developments (12 in total), these had an average decision time of 23.7 weeks.
3.2. Major Housing Developments
Major Housing developments are those with 50 or more dwellings or have a site area that is or exceeds 2 hectares where the predominant use is for housing.
For applications subject to average time calculations there were a total of 30 major housing developments decided during the first quarter of 2017/18 and the average decision time was 44.2 weeks, quicker by just over a week compared to the previous quarter (45.6 weeks) and just over four weeks quicker than the quarter one figure for 2016/17 (48.3 weeks) ( Quarter 1, 2017/18 – Table 7).
Chart 25: Major Housing Developments: Number of decisions
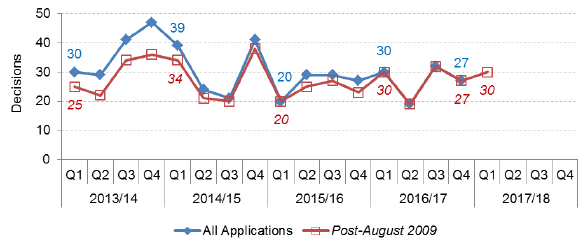
Chart 26: Major Housing Developments: Average decision time (weeks)
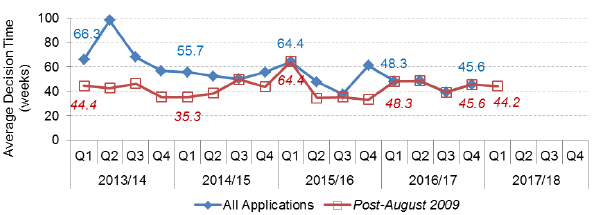
Average figures based on a small number of applications can be volatile. In this quarter there were nine applications with a decision time of more than one year, three of these had decision times of more than two years. 70 per cent (21 of the 30 major housing development applications) were decided in a time that was quicker than the average. For further detail on the distribution of decision times for major housing see Annex A.
In addition, there were 9 major housing applications that were subject to processing agreements with 5 (55 per cent) of these meeting agreed timescales.
3.3. Major Business and Industry
Major Business and Industry developments are those with floor space that is or exceeds 10,000 square metres or have a site area that is or exceeds 2 hectares.
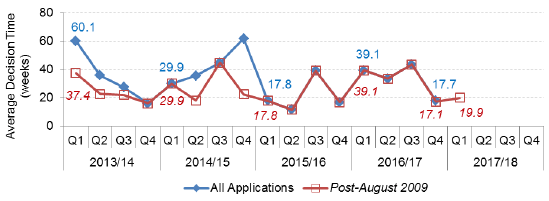
There were four major business and industry developments in quarter one of 2017/18. These had an average decision time of 19.9 weeks, slower by more than two and a half weeks compared to the seven developments in the previous quarter (17.1 weeks) ( Quarter 1, 2017/18 – Table 9).
Average figures based on a small number of applications can be volatile. This quarter the time taken for major business and industry decisions ranged from 10 to 38 weeks. For further details on the distribution of decision times for major business & industry developments see Annex A.
Chart 27: Major Business and Industry Developments: Number of decisions
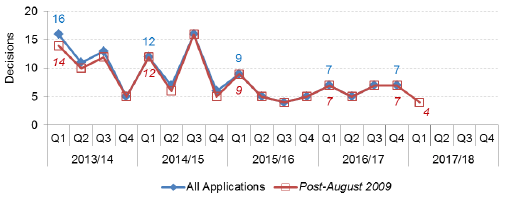
Chart 28: Major Business and Industry Developments: Average decision time (weeks)
In addition, there was one major business and industry application that was subject to a processing agreement and that met agreed timescales.
3.4. Major Other Developments
Major other developments are where the gross floor space of any building, structure or erection as a result of such development is or exceeds 5,000 square metres or the area of the site is or exceeds 2 hectares.
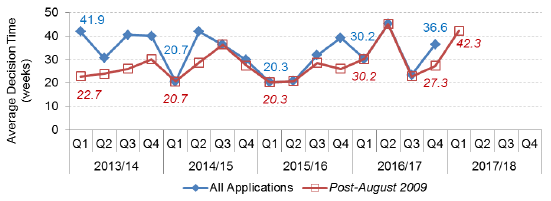
There were 17 major other developments in quarter one of 2017/18. These had an average decision time of 42.3 weeks, 15 weeks slower than the previous quarter (27.3 weeks) and the slowest for any quarter since the start of the data collection in 2012/13. The average decision time of 42.3 weeks has been strongly influenced by a single application with a decision time over 7 years. If this application is excluded the average decision time drops to 21.2 weeks ( Quarter 1, 2017/18 – Table 11).
Fifteen of the seventeen major other development applications (88 per cent) were decided in a time that was quicker than the average. For further detail on the distribution of decision times for major other developments see Annex A.
Chart 29: Major Other Developments: Number of decisions
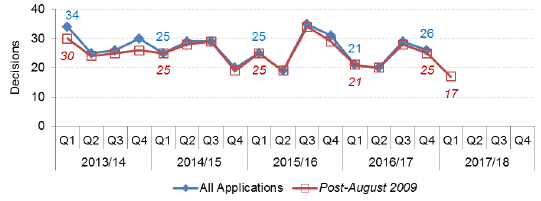
Chart 30: Major Other Developments: Average decision time (weeks)
In addition, there were nine major other developments that were subject to processing agreements with seven (78 per cent) of these meeting agreed timescales.
Contact
There is a problem
Thanks for your feedback