Planning performance statistics: second quarter, 2017-2018
The latest statistics on planning application decision-making and timescales from July to September 2017-2018.
5. Legal Agreements
The timescales for applications with legal agreements are dependent on the nature of the application, the particular complexities involved and the willingness of both the applicant and the planning authority to progress the matter at pace.
The figures exclude applications with processing agreements.
5.1 Local developments with Legal Agreements
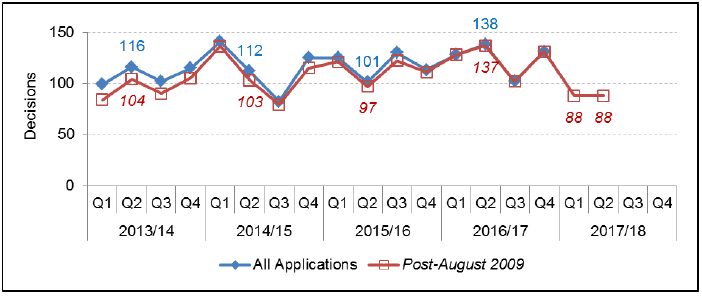
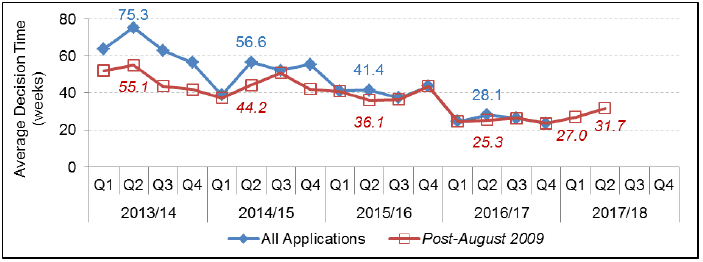
In quarter two of 2017/18 there were 88 applications for local developments where planning authorities had planning/legal agreements in place, the same number as the previous quarter. The average time taken to make decisions on these applications was 31.7 weeks, slower by over four weeks than the previous quarter (27.0 weeks) and over six weeks slower than quarter two in the previous year (25.3 weeks) ( Quarter 2, 2017/18 – Table 3).
Chart 31: Local developments with Legal Agreements:
Number of decisions

Chart 32: Local developments with Legal Agreements: Average
decision time (weeks)

The average decision time figure of 31.7 weeks has been influenced by a number of lengthier times including 15 that each took longer than a year, seven of these taking longer than two years.
5.2 Major developments with Legal Agreements
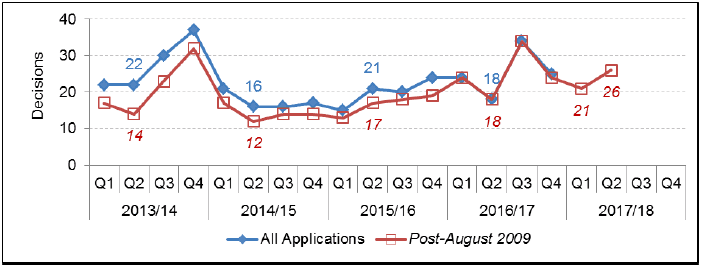
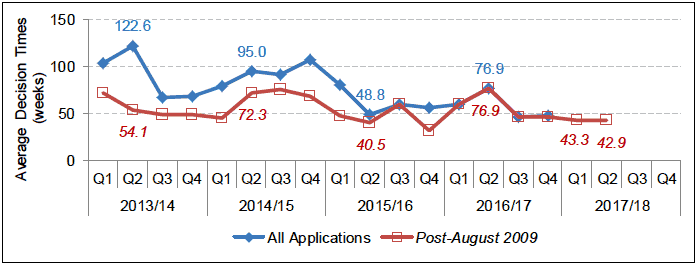
In quarter two of 2017/18 there were 26 applications for major developments where planning authorities had planning/legal agreements in place. The average time taken to make decisions on these applications was 42.9 weeks, almost 3 days quicker compared to the previous quarter (43.3 weeks) and 34 weeks quicker than the equivalent quarter figure for 2016/17 (76.9 weeks). Included in this quarter's figures are six decisions that took longer than one year; one of these taking over three years. The timescales involved in concluding legal agreements prior to issue of planning permission will have had a significant influence over the average decision time ( Quarter 2, 2017/18 – Table 2).
Chart 33: Major developments with Legal Agreements: Number
of decisions

Chart 34: Major developments with Legal Agreements: Average
decision time (weeks)

The 2015/16 Q4 All Applications figure was revised in
January 2018 from 72.9 to 56.3
Contact
There is a problem
Thanks for your feedback