Planning performance statistics: third quarter 2017-2018
This report presents the latest summary statistics on planning, decision-making, and timescales for October to December 2017 (quarter 3).
Annex A: Distribution of Decision Times for Major Applications
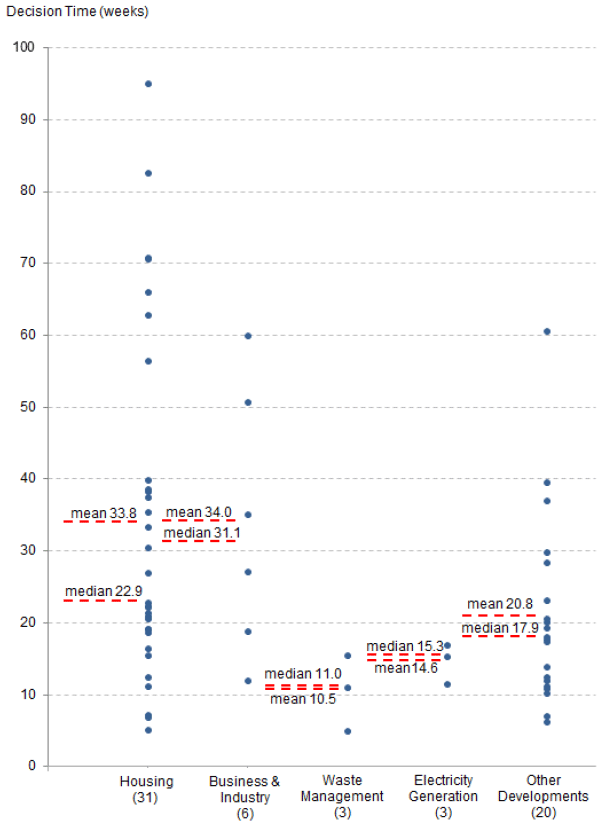
The following chart shows the distribution of the decision times for major applications that were concluded between October and December (quarter three) of 2017/18. Each column of dots in Chart 35 shows the distribution of decision times for the applications. Each dot represents one application (some dots land on top of one other). The horizontal lines show the mean and median decision times.
Chart 35: Distribution of decision times in quarter three 2017/18 for major applications (excludes one legacy case)

For the 31 major housing developments decision times ranged from 5.1 weeks to 95.1 weeks (1.8 years). 61 per cent (19 of 31 major housing development applications) were decided in a time that was quicker than the mean. The mean decision time has been influenced by a few lengthy decisions. There were seven applications with a decision time longer than one year.
There were six major business and industry developments with decision times ranging from 12.0 to 60.0 weeks.
There were three major waste management applications with decision times ranging from 5.0 to 15.6 weeks.
There were three major electricity generation developments with decision times ranging from 11.6 weeks to 17.0 weeks.
Decision times for 20 major other developments application ranged from 6.3 weeks to 60.6 weeks (1.2 years). One application had a decision time of over a year. Fourteen of the 20 major other developments applications (70.0 per cent) were decided in a time that was quicker than the mean.
Contact
There is a problem
Thanks for your feedback