Poverty and Income Inequality in Scotland 2014-17
Estimates of the number and proportion of people living in poverty in Scotland in 2014-17.
This document is part of a collection
Gender and poverty: Poverty for working-age women higher than men in recent years
It is difficult to measure each individual’s income in a household, because income is measured at a household level. Everyone in a household will be either above or below the poverty threshold. This methodology means that for the 60% of women and men who live in couple families (with or without children), the measured rate of poverty will always be similar. In the analysis below, we therefore only include single people.
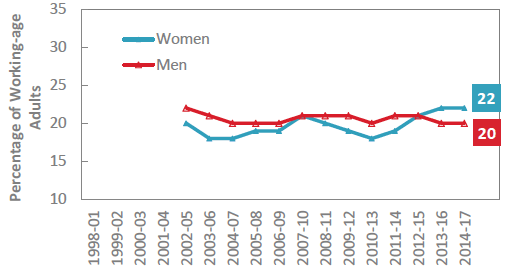
Relative poverty rates for single working - age adults without dependent children , by gender
Ch25. Before housing costs
Over the last 10 years there has generally been little difference between men and women and in 2014-17 22% of single working age women were in poverty compared to 20% of single working age men.
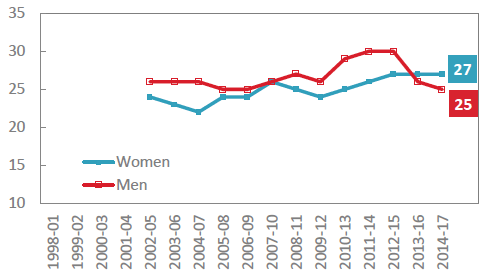
Ch26. After housing costs
After housing costs are taken into account, the rate of poverty in 2014-17 is slightly higher for single working age women (27%) than men (25%). The increased poverty rate for working-age men from 2010-13 through to 2012-15 is due to an unusually high poverty rate in the sample in one of the years, and might not reflect a genuine increase. In the following years, the rate of poverty for working-age men has fallen back to previous levels.
Lone parents
Lone parents were excluded from this analysis, but are included in the analysis on the next page.
Gender and poverty: Poverty for working-age women higher then men in recent years
In the analysis below, all single working-age adults are included, whether or not they have children.
Relative poverty rates for single working - age adults , by gender
When lone parents are included in the analysis, the gap between poverty rates for men and women increases. The reason for this is that the poverty rates for lone parents are higher than for single working-age adults without children. Around 90% of lone parents are women, so the poverty rate for all single working-age women will see a larger increase than for men when lone parents are included.
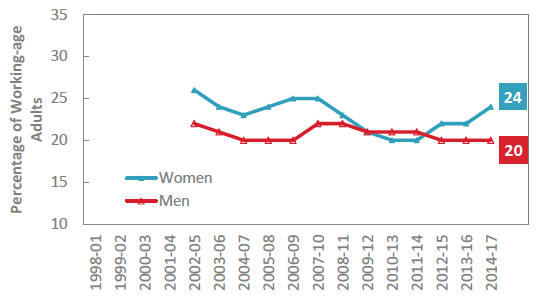
Ch27. Before housing costs
In 2014-17, the poverty rate before housing costs of single working-age women was 24% and 20% for men. Over the past ten years, the poverty rate has been slightly higher for women in most years. The gap narrowed between 2007-10 and 2011-14, as the poverty rate for working-age women fell slightly, though this has reversed in recent years.
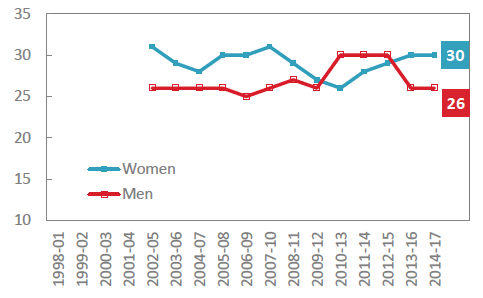
Ch28. After housing costs
After housing costs, the poverty rate of single working-age women was 30% in 2014-17. In comparison, the poverty rate for single working-age men was 26%. The poverty rate for women has largely remained stable at around 30%, though dipped slightly between 2008-11 and 2011-14, before increasing again. The poverty rate for men increased from 2010-13 through to 2012-15 due to an unusually high poverty rate in the sample in one of the years, and might not reflect a genuine increase.
Gender and poverty: poverty higher for female pensioners than for male pensioners
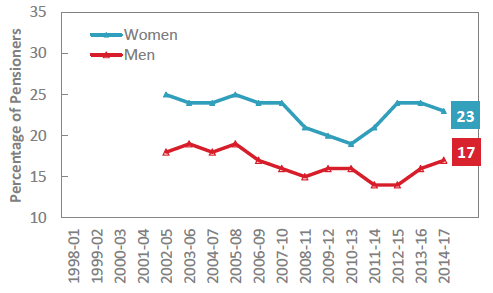
Relative poverty rates for single pensioners, by gender
Ch29. Before housing costs
In 2014-17, 23% of single female pensioners and 17% of single male pensioners were in relative poverty before housing costs.
Over the past ten years, the poverty rate before housing costs for single female pensioners has been higher than that for single male pensioners.
Ch30. After housing costs
In 2014-17 18% of single female pensioners and 11% of single male pensioners were in poverty after housing costs.
The rate for female pensioners has tended to be higher than that for men. The gap closed slightly between 2008 and 2014, but has since widened again.
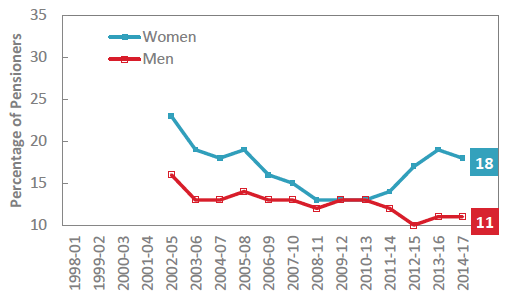
Some of the difference in pensioner poverty between genders may be due to different age profiles. Female pensioners are on average older than male pensioners because of their longer life expectancy. Older pensioners may have access to different income sources which may result in them having lower incomes.
Ethnicity and poverty: poverty higher for minority ethnic groups
Relative poverty rates by ethnic background
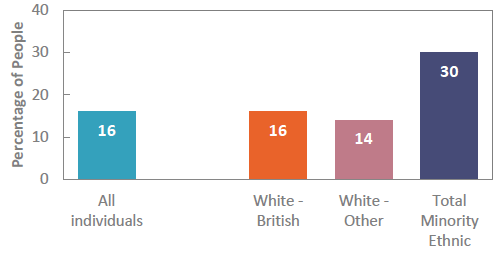
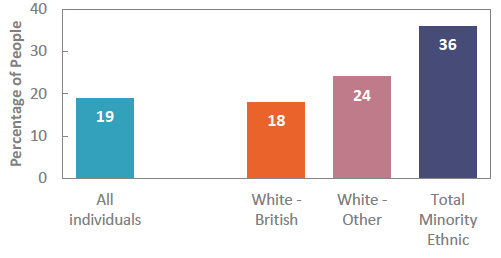
People from minority ethnic (non-white) groups are more likely to be in poverty, both before and after housing costs, compared to those from the 'White - British' group. The poverty rate amongst the ‘White – Other’ group is similar to that of the ‘White – British’ group before housing costs but rises well above it after housing costs.
Ch31. Before housing costs
30% of people from minority ethic backgrounds were in poverty before housing costs in 2014-17. This compares to 16% in the ‘White – British’ category, and 14% in the ‘White – Other’ category.
Ch32. After housing costs
Over a third of people in minority ethnic groups were in poverty after housing costs were taken into account. For comparison, the poverty rate for the ‘White – British’ group was 18%.
More information
Data has been collected for additional categories to those shown above. However, The ‘Asian / Asian British’, 'Mixed', 'Black / Black British' and 'Other' ethnic groups all have sample sizes that are too small to reliably report on their own. Therefore, although it is far from ideal, they have been combined into a single category so that they can be reported with confidence.
Due to the small sample sizes for some of the ethnic groups, the measurement uncertainty will be fairly large. This means that there is uncertainty over the precise poverty rates, making it difficult to compare different years. A time series hasn’t been produced for poverty rates by ethnicity, as this uncertainty in the data will obscure any long-term trends.
Disability and poverty: Poverty higher when a family member is disabled
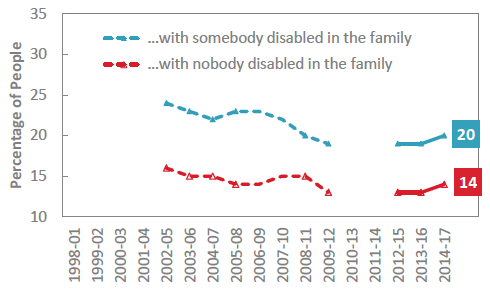
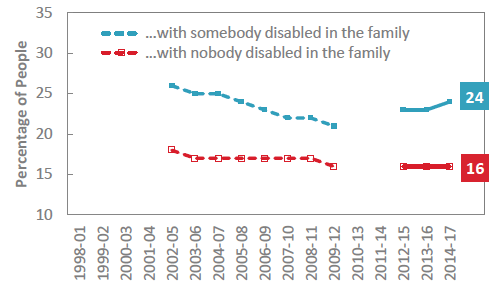
Due to a change in the way information on people with disabilities was collected, it is not possible to compare the most recent years with years before 2012-15, but before that, poverty had been decreasing for both groups. Since 2012/13, disabled people are identified as those who report any physical or mental health condition(s) or illness(es) that last or are expected to last 12 months or more, and which limit their ability to carry out day-to-day activities. [1] Dashed lines in the charts below indicate data collected before the change.
Relative poverty rates by whether a family member is disabled
Poverty rates remain higher for families in which somebody is disabled. The gap between the two groups has remained fairly steady over the last few years.
Ch33. Before housing costs
In 2014-17, 20% of those in a family with a disabled person were in poverty before housing costs compared to 14% of those in families without a disabled person.
Ch34. After housing costs
In 2014-17, the poverty rate after housing costs for families with a disabled person was 24%. This compares with 16% of people in a family without a disabled person who were in poverty.
Additional living costs
The previous measure of poverty doesn’t take into account the fact that additional living costs may be incurred due to the illness or disability in question. The analysis on the following page attempts to make an adjustment to the poverty rates to partly account for this for those households where someone is in receipt of disability benefits.
Disability and poverty: Poverty higher when a family member is disabled
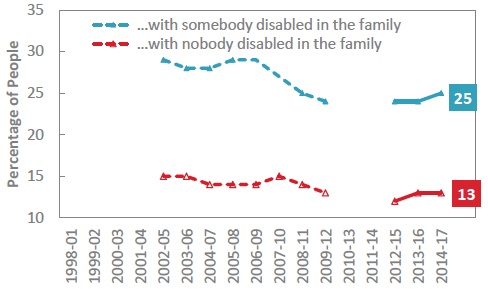
Relative poverty rates after housing costs, with disability benefits removed from household income, by whether a family member is disabled
Whilst it is recognised that there are additional costs associated with disability, research shows that these vary greatly in level and nature, and there is no general agreement on how to measure these costs.
The analysis below excludes Disability Living Allowance, Attendance Allowance and Personal Independence Payments from income. These are benefits paid as a contribution towards the additional living costs that households where nobody is disabled don’t have, so by excluding these from income we are able to compare on a more like for like basis.
Ch35. Before housing costs
In 2014-17, as in previous years, the poverty rate was higher for individuals in families with a disabled person, when disability related benefits are not included. Before housing costs, the poverty rate was 25% for individuals with a disabled family member, and 13% for individuals without a disabled family member.
Ch36. After housing costs
Similar to the before housing costs measure, the poverty rate was higher for individuals in families with a disabled person in 2014-17. After housing costs, the poverty rate was 29% for individuals with a disabled family member, and 16% for individuals without a disabled family member.
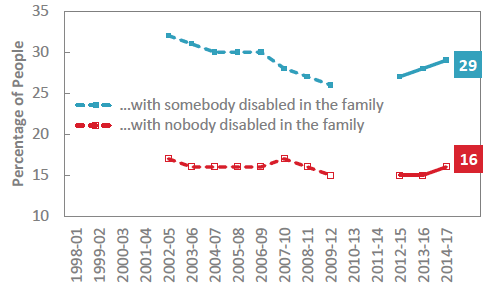
Excluding disability benefits from the analysis results in some households moving down the income distribution, which will lower the median income and poverty threshold. As a consequence, some families without a disabled person that were just below the poverty threshold in the previous analysis will be above the threshold here.
Contact
There is a problem
Thanks for your feedback