Regional employment patterns in Scotland: statistics from the Annual Population Survey 2016
Summary publication of results from the Annual Population Survey 2016, presenting analysis on the labour market, education and training.
2. Economic Inactivity
Economic inactivity covers individuals who are neither employed or unemployed under ILO definitions. There are many reasons why people may be inactive: they may have a long-term illness or disability, be studying for a qualification, staying at home to look after their family, or have retired.
The economically inactive population are not considered an active part of the labour supply during the time period of analysis. However, the labour market is dynamic, with people continuously moving between different categories. Therefore it is important to consider inactivity figures as they include those who may make up the future labour supply and those who were part of the labour supply in the past.
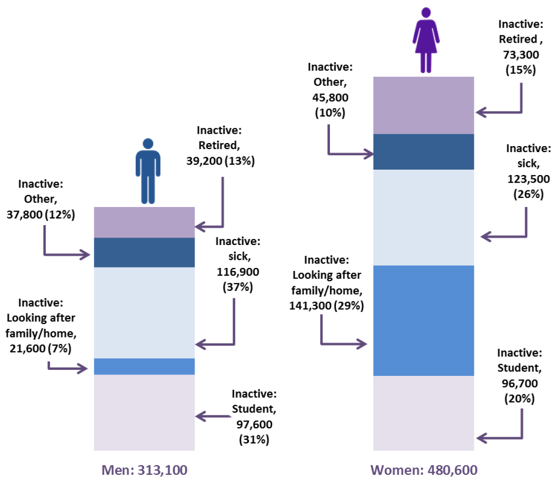
In Scotland, the economic inactivity level (16-64) increased by 30,900 over the year to reach 793,700 in 2016. This was driven by increases in the inactivity level for women (up 24,300 over the year to 480,600) while the inactivity level for men increased by 6,600 to 313,100 in 2016.
The diagram below presents the composition of those aged 16-64 who were economically inactive in 2016.
2.1 Economic Inactivity
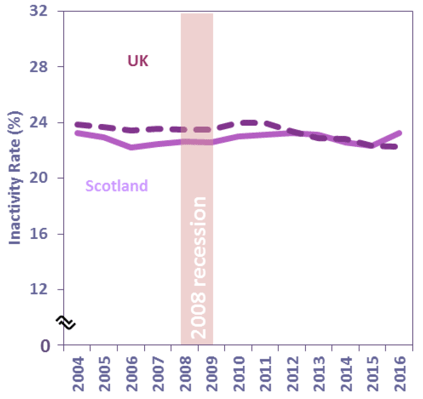
Economic Inactivity rates for Scotland in 2016 was 1.0 percentage points above the UK rate
The inactivity rate for those aged 16-64 in Scotland was lower than that of the UK until 2011. Since 2012, Scotland's inactivity rate followed a similar trend to that of the UK with the rates diverging in 2016 and Scotland having a higher inactivity rate than the UK.
Over the year, the inactivity rate increased by 0.9 percentage points in Scotland to 23.2 per cent and decreased by 0.1 percentage points in the UK to 22.3 per cent.
Economic Inactivity rates were highest in Dundee City, Glasgow City and East Ayrshire
Chart 33: Economic Inactivity Rate (16-64), Scotland and UK
There is considerable variation in inactivity rates for those aged 16-64 across Scotland's local authorities.
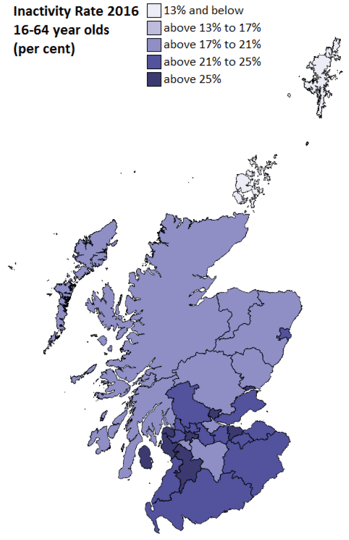
The local authority areas with the highest economic inactivity rates in 2016 in Scotland were Dundee City (28.8%), Glasgow City (28.4%) and East Ayrshire (28.2%). The lowest inactivity rates in 2016 were seen in the Shetland Islands (9.3%), Orkney Islands (12.0%) and Aberdeenshire (17.4%).
Over the year, reductions were seen in 15 local authority areas, with 16 areas seeing increases and one seeing no change. The only statistically significant change over the year was at Scotland level (up 0.9 percentage points from 22.3% to 23.2%).
Since 2008, reductions in economic inactivity rates were seen in 14 local authority areas, while they increased across the remaining 18 local authority areas. Statistically significant changes were seen in Aberdeen City (up 4.9 percentage points from 19.0% in 2008 to 23.9% in 2016) and East Ayrshire (up 4.7 percentage points from 23.5% to 28.2%).
2.1.1 Gender
Increase in the economic inactivity rate for Scotland over the year was driven by increased rates for women
Chart 34: Economic Inactivity Rate (16-64) by Gender, Scotland
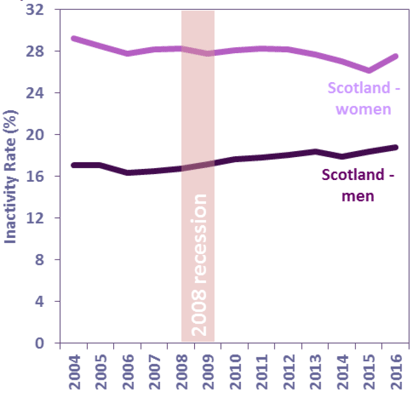
The inactivity (16-64) rate for women in Scotland increased by 1.4 percentage points from 26.1 per cent in 2015 to 27.5 per cent in 2016, driving the increase in the overall economic inactivity rate over the same period (up 0.9 percentage points from 22.3% to 23.2%).
In Scotland, the inactivity rate for men increased by 0.4 percentage points from 18.4 per cent to 18.8 per cent over the year.
Chart 35: Economic Inactivity Rate (16-64) by Gender, Scotland and UK
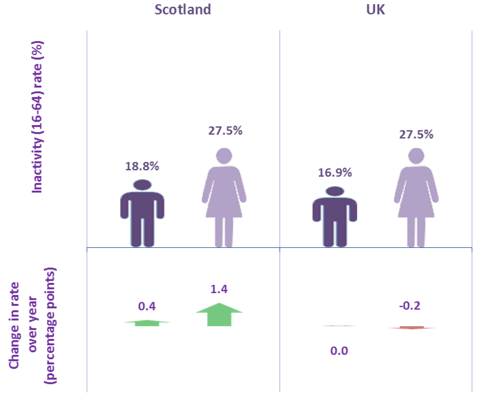
In both Scotland and the UK, the change in economic inactivity rates was driven by women (up 1.4 percentage points to 27.5% for Scotland and down 0.2 percentage points to 27.5% for the UK).
Scotland saw an increase of 0.4 percentage points to 18.8% in the rate for men, while the inactivity rate for men in the UK remained unchanged at 16.9%.
2.1.2 Age
Increase in economic inactivity rates for those aged 16-24 and 35-49 over the year
Chart 36: Economic Inactivity Rate (16-64) by Age, Scotland
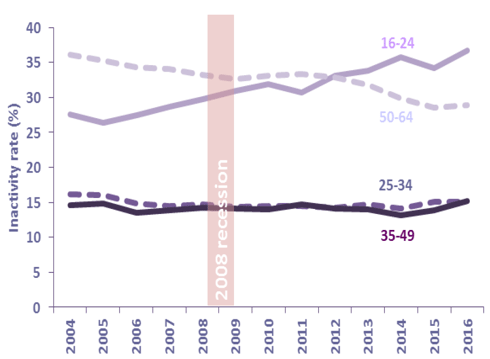
Economic inactivity rates for 25-34 year olds have remained around 15 per cent from 2004 to 2016 while the economic inactivity rates for 35-49 year olds remained fairly constant until 2014 when it started to increase, highlighting that more 35-49 year olds have become inactive in recent years.
Those aged 16-24 have seen their inactivity rates increasing from 27.6 per cent in 2004 to 36.7 per cent in 2016. In contrast, inactivity rates for those aged 50-64 have generally been decreasing over time, highlighting that more people aged 50-64 are moving from being economically inactive to being in employment.
Over the year, women are driving the increase in the inactivity rates for those aged 16-24 (women up 3.2 percentage points from 34.3% to 37.5% while men increased by 1.8 percentage points from 34.1% to 35.9%) and for those aged 35-49 (women up 1.9 percentage points from 16.9% to 18.9% while men increased by 0.6 percentage points from 10.6% to 11.3%).
2.1.3 Reasons for Inactivity
Over 50 per cent of the 793,700 economically inactive people in Scotland were inactive because they were long-term sick or students
Chart 37: Reasons for Inactivity, Scotland
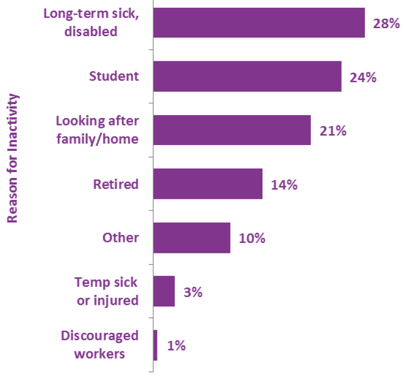
Of the 793,700 economically inactive people (aged 16-64) in 2016, the main reasons for being inactive were long-term sick or disabled (218,400, 27.5%), student (194,300, 24.5%) and looking after family/home (162,800, 20.5%).
Increase in economic inactivity levels since 2008 driven by increases in the number of students
Chart 38: Change in Reasons for Inactivity since 2008, Scotland
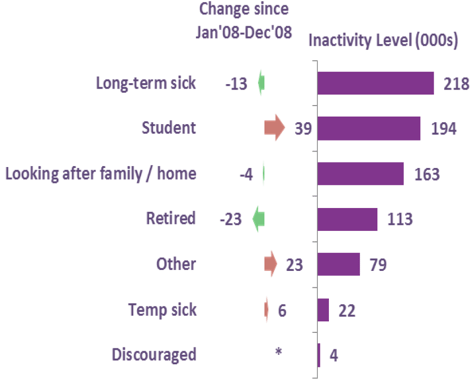
Economic inactvity levels in Scotland have increased by 29,400 since 2008. This has been driven mainly by a 39,000 increase in the number of students who were inactive as well as those who gave 'Other' as the reason for being inactive (up 22,700).
More recently, increases over the year were seen in the numbers looking after family/home, long term sick or disabled and 'Other' who were inactive (up 13,800; 12,400 and 11,200 respectively) while decreases were seen for the number of retired people and students who were inactive.
2.1.4 Want to Work
23.7 per cent (188,400) of economically inactive people aged 16-64 in Scotland wanted to work, but were not currently able to do so
Chart 39: Proportion of All Economically Inactive (16-64) Who Would Like a Job, Scotland
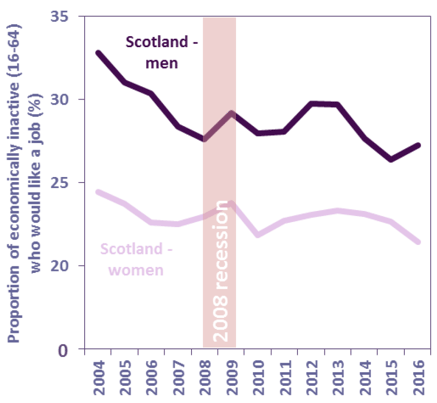
The proportion of those who were economically inactive but who wanted to work has decreased since 2013, having previously been on an upward trend since 2010. The proportion of those who were economically inactive who would like a job decreased by 0.4 percentage points from 24.2 per cent in 2015 to 23.7 per cent in 2016.
The proportion of economically inactive women aged 16-64 who would like a job decreased by 1.2 percentage points from 22.7 per cent in 2015 to 21.5 per cent in 2016, driving the decrease in the overall proportion of economically inactive people who would like a job. The proportion of economically inactive men aged 16-64 who would like a job increased from 26.4 per cent in 2015 to 27.2 per cent in 2016 (0.9 percentage point increase).
2.1.5 Never Worked
149,600 people in Scotland in 2016 had never worked (excluding students aged 16-24 in full-time education
Chart 40: Number of People Who Have Never Worked (16+), Scotland
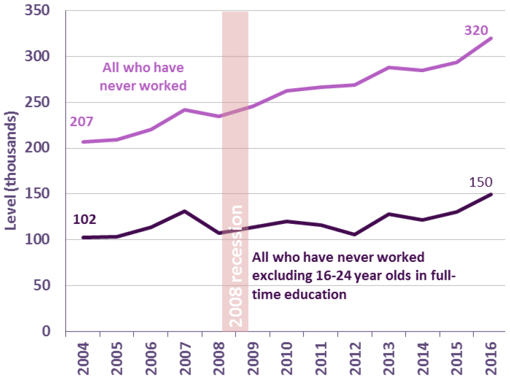
In 2016, 319,600 people in Scotland aged 16 and above had never worked [15] . This has increased by 26,100 over the year. Over half (53.2%) of these are 16-24 year olds in full-time education.
Excluding 16-24 year olds in full-time education, there were 149,600 people in Scotland who have never worked; an increase of 19,600 over the year.
Over the year, reductions in the number of people who have never worked were seen across 10 local authority areas. The largest increases in the number of people who have never worked were in Aberdeen City (up 15,500), Glasgow City (up 10,400) and Edinburgh City (up 6,600).
Contact
Email: Claire Gordon
Phone: 0300 244 4000 – Central Enquiry Unit
The Scottish Government
St Andrew's House
Regent Road
Edinburgh
EH1 3DG
There is a problem
Thanks for your feedback
