Introduction of an Infrastructure Charging Mechanism in Scotland: research project
This research focuses on the options for an infrastructure charging mechanism.
Annex D. Existing Use Value Chart
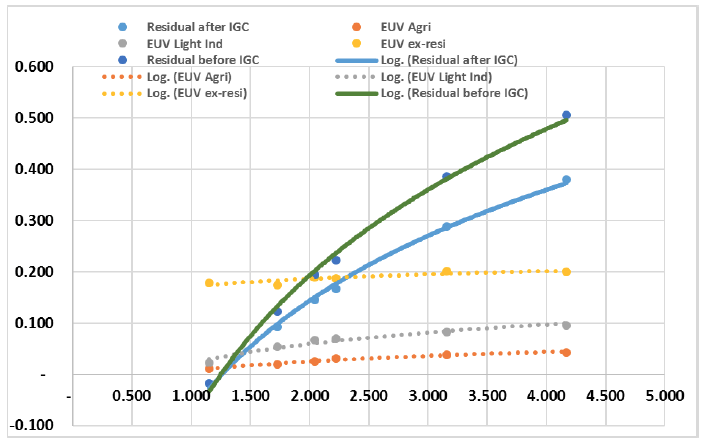
The chart below shows the modelled relationship for the average residential market scheme by outturn price band – ( GDV in £k psm GIFA horizontal scale), with the Residual Land Value before and after IGC with typical Existing Use Values (£k psm GIFA vertical scale).

The Existing Use Values are shown before any reduction in land prices caused by IGC.
The chart highlights the limitations for increasing an IGC rate if we are to account for a wide variety of Existing Use types and Values without impairing viability.
The chart also shows that where land already has residential use then outturn values will probably have to exceed the national average outturn value (£2,200 psm), as well as at a higher density of site use, for the new residential development to be viable. [Where yellow dashed line exceeds Green or Blue solid line.]
Contact
There is a problem
Thanks for your feedback