Introduction of an Infrastructure Charging Mechanism in Scotland: research project
This research focuses on the options for an infrastructure charging mechanism.
6 Mechanics and Delivery
6.1 Uniform Charge Formula
This section establishes the detailed options for uniform charges. It sets out the general differences between various charging options that would be applied under the delivery options discussed in Section 5. The charging options are summarised along with the Central versus Local Co-ordinated Options in Table 6-6 at the end of this section. This section starts with a discussion on the ability to pay.
Land Value Uplift
There is much discussion, and public interest, in the capture of land value that accrues to landowners (private benefit) from decisions made about permitted land use changes (collective benefit). Nearly all land value derives from investment in infrastructure and from its practical, permitted use. Most land value uplift results from public investment in infrastructure and the collective development rights. The balance between public and private infrastructure varies between countries with around 50% of infrastructure in England provided through private enterprise and with a lower private proportion in Scotland and in most of the rest of Europe.
Furthermore, the minimum amount that should be fairly paid to a landowner to release land for development is not the existing use value of “bare land”. It may now have a higher productivity. There may be buildings and other capital assets fixed to the land. Infrastructure may have improved access to markets. An amount should be included to reflect the market expectations of the land value and assets resulting from the development of land nearby. Compensation for loss of business or moving of the business should also be paid. And finally, there should be a premium or a sufficient return on the above to make the sale worthwhile. In consequence, the land value uplift from a permitted change of use is usually much smaller than the simple difference between “bare” pasture land value and a housing site value.
The interdependency of land value uplift with infrastructure to serve that land (however distant) justifies a contribution of some of that uplift to the costs of the additional infrastructure.
A charge on land value arising from consents that add value, provide a mechanism for adding to necessary infrastructure investment so that additional land can be brought to development. It can provide a small but material amount of funding to add to other sources of funding for infrastructure.
Approximate relative proportions of all contributions to the whole nation’s need
for growth in, renewal of, and improvement of infrastructure are set out below in Table 6-1:
Table 6‑1 Relative Proportions of Contributions
| Proportion of infrastructure provision through | % |
|---|---|
| On site infrastructure e.g. site roads, and utility connections | 3% |
| Planning obligations (whether on or off site) at full potential | 6% |
| Infrastructure Charge (e.g. Infrastructure Growth Contribution) | 2% |
| Government investment (including via councils and others) [14] | 56% |
| Private enterprise investment | 33% |
| Total | 100% |
It can be seen that an Infrastructure Contribution Charge can make a small, but important, contribution to all infrastructure needs. There is, however, an upper limit to the amount any one site can contribute without affecting development viability. To understand this a calculation of residual land value needs to be made and compared to existing use values of land.
6.2 Residual Land Value Calculations
There is a practical limit to the level of a charge. It should not be so high as to reduce the amount of land that will come to the market. The charging formula has been designed to reflect difference between residual land values (the difference between Gross Development Value and Gross Development Cost) and existing use values of the land. This difference is highly variable and sensitive to all elements in the development equation, but our analysis shows that the main contributor is the Gross Development Value (in per square metre terms), which in turn is driven by the value uplift generated by the consented use. The result is a non-linear formula.
In terms of existing developer contributions these have been assessed at a potential level assuming all authorities were robustly and consistently applying relevant obligations. The current actual value of obligations is lower, as not all authorities have made or apply the relevant policies through Development Plans and associated Supplementary Guidance.
Buffer
The charge is based on the difference between RLV and EUV (plus premium etc.) with the actual calculation based on GDV per square metre and the floor area of the development and allows for a “buffer” to deal with the wide variation in this difference from site to site. Annex D describes the relationship with EUV in more detail. The analysis used for this assessment takes average values and costs at various value bands. In practice, there will be a range of residual values in each value band and some may be significantly lower than the band average. In order to minimise the risk that the charge may cause some developments to become unviable, the buffer is introduced to ensure that the charge “captures” no more than 25% of the residual balance.
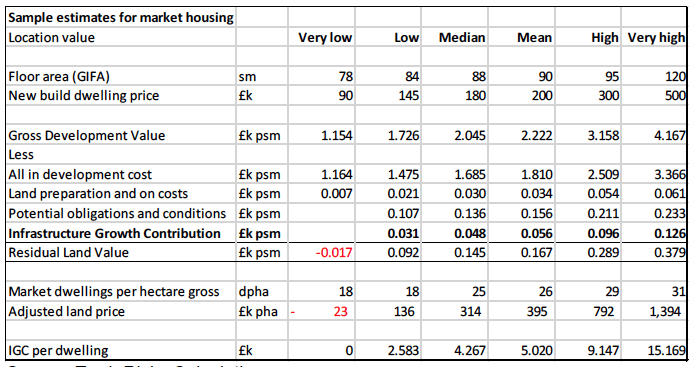
Table 6-2 shows a sample of these calculations expressed as an amount per square metre of floor area, and shows the proposed IGC amounts in £000’s per square metre:
Table 6-2 Sample Estimates for Market Housing

Source: TradeRisks Calculations
The charge amounts are a proportion of GDV with the rate of growth of the proportion gradually tailing off (i.e. non-linear). This is consistent with the fact that build costs increase with, but are not linear with respect to, sales values. High value dwellings by £ per square metre (often in dense and/or tall inner-city structures) have higher build costs by £ per square metre than the equivalent proportion of cost to value in lower value developments.
At very low values the average scheme becomes unviable; it cannot support a charge or planning obligations and the negative RLV shows that there is no balance available to buy land. There may, of course, be some schemes, with below average costs, at these GDV values that prove viable, though the incidence will be statistically small.
6.3 A non-linear formula based on value of output
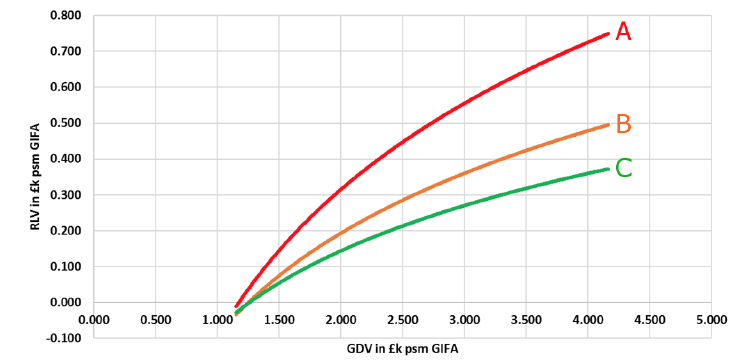
Figure 6-1 below illustrates thie non-linear pattern described above:

The red Line A shows the residual balance (vertical scale) before planning obligations and IGC for different outturn values (horizontal axis).
The orange Line B shows the residual land value after potential planning obligations, and the green Line C after the proposed non-linear charge.
The charge is the difference between Line B and Line C and in best fit terms is a log natural relationship to GDV, specifically:
IGC = (0.1 x Log e( GDV)) – 0.023
or
IGC in £’000s per square metre of Gross Internal Floor Area = one tenth of the Log to base e of GDV expressed in £’000s per square metre, all less £23 per square metre [15] .
This non-linear formula produces the estimate maximum, safe, potential for the charge.
An alternative option is to introduce a flat rate charge.
6.4 A flat rate charge per quantum of output
This will be easier to understand but would not be as fair. Moderate value schemes will pay proportionately more than higher value schemes. A flat rate would require a “cliff-edge” threshold of GDV below which charges would not apply. The rate and the threshold would require regular review to keep pace with inflation (see Table 6-2 below). Finally, a flat rate would deliver significantly less funding overall.
The threshold would need to be set where the flat rate is least likely to cause schemes to become unviable. The higher the rate, and hence the higher the threshold, the fewer dwellings would be chargeable. This “Laffer curve” effect indicates that the flat rate level today that delivers the maximum funding, if applied consistently across Scotland, is approximately £30 psm.
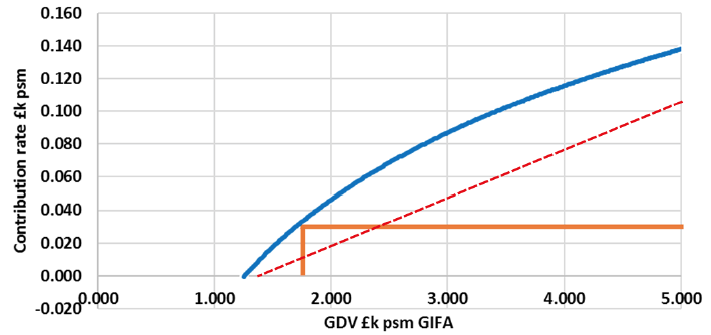
The non-linear (blue line) and flat rate (orange line) are shown in Figure 6-2 below:
Figure 6-2 Contribution Rate and GDV

It can also be deduced that a standard % of GDV rate for the charge, (the rising red dashed straight line on Figure 6-2) would also require a threshold at the lower GDV end as well as a slope that did not make the highest value developments unviable, i.e. does not cross the blue line for GDV values as shown in Figure 6-2.
Though as simple to explain as the flat rate, a % rate delivers even less funding in aggregate. The % rate would be lower than £30 psm for the majority of dwellings, i.e. those with values below a GDV of £2,500, and higher above that but for an insufficient volume of schemes to make up the difference.
6.5 Distribution of market housing outturn values in Scotland
With data provided by Scottish Government and the Energy Saving Trust an analysis at individual dwelling level was possible by matching addresses and price paid with internal floor space assessed for the Energy Performance Certificate. From this a distribution of market sales values in price per square metre can be shown.
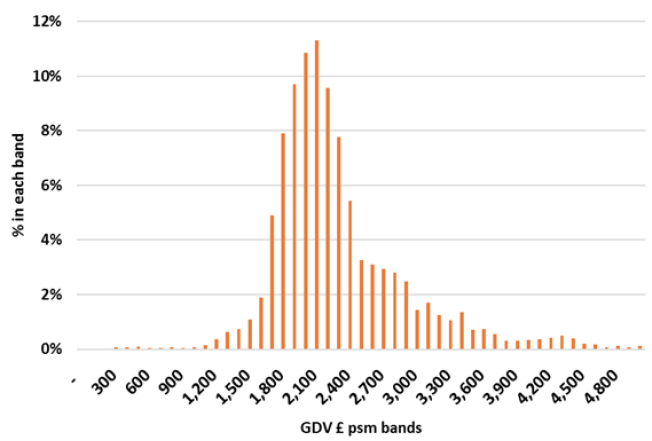
The shape of the distribution of GDV (in £000 psm GIFA) across Scotland’s new build market housing supply is material to the calculation of the charge and the estimate of the total that could be collected. An estimate of distribution is shown in the Figure 6-3 below.
Figure 6-3 GDV Distribution

From this it can be seen that a minority of market dwellings will not be charged which ever method is chosen. These are those with outturn values below, say, £1,250 psm, or a small detached house at £105,000 for the non-linear charge, or about £1,750 psm for the flat rate charge.
6.6 National or Local Rate
We have considered whether flat rates at different levels and thresholds could be set for each district or even sub-areas within districts. At first sight this might allow adjustment for different values across Scotland. But there are two significant disadvantages.
The first is that in any level of geography in Scotland there will be schemes which cannot support a charge, and with thresholds and rates set low enough for schemes just above that viability level there will be higher value schemes that could contribute more.
The second is that either side of each “boundary” between districts there will be different rates, even for opposite sides of a street. In general rates differentiated by area will cause market distortions and should be avoided.
6.7 Other Impacts
Impact of a Charge on Land Prices
In many sectors, a charge on the producer will lead to a reduced profit to the producer and a higher price for the consumer. The charge imposed is shared between the producer and customer.
But in terms of land and housing, consumers pay as much as they can afford. The tax on the producer does not change what the buyer can afford; but it does change what the producer can pay for their inputs. There is little scope for reducing amounts paid for materials and labour and so the amount that can be paid for land has to reduce, as long as everyone else is similarly affected in their ability to pay for land at the same time.
The charge would reduce residual land values, though it would not change development revenues or any other cost of development. It may even improve developer profitability as the reduced capital cost of land in the early months of the overall cash-flow will reduce financing costs and improve rates of return.
If the charge were set too high, it could also reduce the voluntary supply of land. Measures such as Compulsory Purchase Orders and even Requisition would have to be used to maintain let alone increase output. The non-linear formula has been set to ensure that in 90% to 95% of schemes the charge comes primarily from the uplift amount arising from change of use consent. It has less of an effect on Existing Use Value (plus compensation and premium) above mean GDV. This gap becomes much smaller at the lower outturn value and hence the IGC, with the non-linear formula, tails away to zero.
Affordable Housing
The analysis above takes account of the growing number of authorities specifying that for schemes above a local threshold (ranging from 4 to 12 dwellings in published supplementary guidance) 25% of dwellings should be affordable housing with plots provided at no land cost by way of planning obligation. Our estimate is that this could potentially apply to 50% of all market housing development sites, the rest being below the scheme size threshold.
It is proposed that affordable housing, with open market values above the IGC threshold, should contribute to the charge. About 40% would fall below the non-linear charge threshold and about 70% below the £30psm flat rate threshold.
It seems, at first sight, counterintuitive to add a development cost to Affordable Housing as that might just add to the public subsidy (grant) required for a given rental discount to market. There are two reasons for relaxing on this point.
The first is that the developer’s contribution (in the form of the charge) for all housing will be passed on as a reduction in the land price paid for the whole site and not be a cost that is included in the price paid by the affordable housing provider to the developer. The same will apply to a provider developing their own affordable housing. Their land cost will reduce by the amount of the charge.
Secondly, in a competitive land market, one kind of provider should not have an advantage over another. An Affordable Housing provider acquiring land without a charge or planning obligations [16] could pay more for the land than a market developer. In many cases the two markets only overlap at the higher value range of housing association development, and then only where the provider is acquiring land on the open market; furthermore, there are controls within procedures associated with grant eligibility to ensure that providers do not pay more than the market would pay. But even if the instances are small the principle of avoiding market distortion should be applied. An IGC exemption for affordable housing could be a breach of State Aid rules.
Section 75 and other Obligations and Conditions
There is potential for a charge to reduce the amount of planning obligation that a scheme close to the edge of financial viability could bear. It is more likely, however, that a charge will reduce the land price paid and not the amount available to the developer to meet S75 obligations. Estimates of IGC and S75 can be made at land acquisition stage to inform the offer price for land. The actual amount of IGC will depend on values at completion which also have to be estimated in advance by developers, and could increase or decrease.
To avoid IGC impacting on the ability to support S75 obligations, it has been assumed that S75 agreements become more widely used than they are currently, and are more consistently applied. In approximate terms current S75 obligations have a value in the order of £130m pa; it is assumed that this will increase to £205m pa.
It may be possible to set a limit to the types of infrastructure that can be funded by S75, in addition to the requirement for direct relevance to the development. Most frequent occurrences are of: education, highways and transport, affordable housing, public realm and open space. If for example these were limited to primary school, pre-school and the aged band related SEN; to plot value only for affordable housing; and so on, the “variable” amount of planning obligations could be capped. In these circumstances, the IGC charge rate could be increased beyond the levels modelled as part of this assessment.
Other Strategic Infrastructure Funds
The Aberdeen City and Shire Strategic Transport Fund Supplementary Guidance has been quashed by the Court of Session, as it was found to be beyond the planning obligations policy test; in particular, that the charge for the infrastructure didn’t sufficiently relate to the proposed development. The decision has been appealed and a hearing was held by the Supreme Court on 13 th June 2017.
There is a concern in the development industry, and land ownership sectors, that funds like this, for other types of strategic infrastructure and across all planning authorities, could be established, each with their own terms and conditions (and even lifespan).
These funds would of course, be for the same purpose as a charge, and so if IGC were adopted it would become the source of funding for contributing to these strategic purposes. In effect, the Aberdeen City and Shire STF would have a clear legal basis as a sub-set of the overall charging regime.
Non-residential Development
It is proposed that buildings which people use should be eligible developments for the charge, subject to the same formula rates based on GDV.
A significant majority of non-residential buildings will have (open market) values below the £1,250 psm threshold. For example, it is estimated that 90% of new manufacturing premises, by floor space, would fall below. Very few buildings that might be classed as infrastructure will have high enough open market values to pay a charge. Notably, some non-residential uses do have high values, for example a city centre office in Edinburgh might exceed a GDV of £6,000 psm, but these will represent a low proportion of the distribution of all office values across Scotland.
Non-residential development will provide a smaller, but material, aggregate level of IGC funding compared market housing.
6.8 Funding Potential
The estimate is that, nationally using the non-linear formula, residential land price reductions could safely fund £65m per annum (£33m with the £30 psm flat rate) and that non-residential land price reductions could fund £10m (£6m respectively). A total of £75m (£39m) per annum at today’s prices.
The estimate using a national optimum flat rate of £30 psm is that residential land value reductions could fund £33m per annum and that non-residential land price reductions could fund £6m. A total of £39m per annum at today’s prices.
See Annex C for a table showing the summary by sector and GDV value distribution of this analysis.
Inflation
The non-linear formula, being based on GDV, would keep pace with inflation for between 10-12 years without requiring any uprating reviews.
A flat rate charge would require frequent (perhaps annual) reviews of the rate and the threshold to keep up with the leveraged inflation of land values and uplift. [17]
Start-up Profile
Funds would not start to accrue until four years after the announcement of the intended introduction. This lead in time—i.e., before the charge applies to all development above the threshold values—is based on the time needed for existing consents, which will not be charged, to work through to completion, and for new consents, which will be charged, to reach completion. They will flow from completions from planning consents given after the implementation date.
On the one hand, this meets the industry’s request that any infrastructure charge be levied when the sales proceeds are available rather than at an early (cash-flow sensitive) stage of development. On the other hand, the goal of front funding infrastructure cannot be met by a “back loaded” payment.
Over time, the flow of funds in would match the annual outflow required to contribute to the infrastructure that makes additional land developable.
One option is that Scottish Government could consider pump-priming the system. In exchange, for example, for costed, infrastructure plans being made by planning authorities (whether or not combined with others) Scottish Government could allocate an annual sum (e.g. £30m nationally), and rising, until there is a steady state flow of income. This could have a smoothing effect on the introduction of the proposal, and could be refunded slowly over later years
Reducing Market Uncertainty
Any changes to the financial and economic framework of development can have an unsettling effect. Sometimes a “shock” can damage output. This is especially true for the land market in the current context of political and legislative uncertainty. The danger is that owners will hold on to land until they are clear about the possible effects of a charge and a general settling of activity has taken place.
The long lead time provided by consultation stages by an announcement perhaps one year ahead of implementation date, and the pump-priming option, may help to reduce uncertainty and minimise the “shock”. There is a risk that there may be a surge of planning applications attempting to get consent before the IGC implementation date.
Economic Effects
The charge will not affect sales values or developer’s returns but it will impose downward pressure on land prices as it will reduce the amount that developers can pay for land. It is important that all developments are treated in the same way, whether by the private or public sector and across all uses. Any exceptions will distort fair competition in the land market.
At the macro-economic level, there would be no adverse effect on Gross Domestic Product ( GDP). This is due to resources being redistributed: a part of land value and uplift is exchanged for infrastructure.
The reduced spending power of landowners may affect consumption and investment by those landowners but it is likely that a material proportion of that spending would not be within Scotland, whilst all infrastructure spend would be within Scotland. There would be a small reduction of tax receipts from landowners through capital gains, inheritance tax and consequent indirect taxes of consumption. This reduction will be small as taxation of receipts from land sales is greatly reduced by capital gains roll-over relief, through the operation of Trusts, and overseas ownership structures.
A £75m per annum reduction in land prices paid by developers (i.e., through the ‘non-linear’ approach) represents about 10% of the Scottish land market for development, and to put this into scale is about 2% all development activity in the Scotland, or less than 0.05% of Scottish GDP.
6.9 Options for a Charging Mechanism
The charging mechanism for IGC can be narrowed down to two proposed options—a non-linear rate and a flat rate. Table 6-6 outlines the combination of the two charging mechanisms with the Central and Local Co-ordinated options.
While more complex, the non-linear rate formula is more sensitive to residual land values and would provide against regular adjustment for inflation. It would also reduce the burden on lower value developments. It could also raise £75m pa and be progressive relative to value.
A flat rate, while providing a simpler option set at a local or national level, is regressive and would potentially negatively impact lower value developments. It would also require regular indexing and inflation review. It would raise less than the non-linear formula, estimated at £39m pa, and would be retrogressive relative to value.
Table 6‑3 Mechanisms Assessed by Delivery Option and Charging Options
| Delivery Options | Central Co-ordinated Option | Local Co-ordinated Option |
|
|
|
| Charging Options | ||
| Non-linear formula Set nationally Based on floor area and GDV |
|
|
| Flat rate formula Set nationally Based on floor area |
|
|
Contact
There is a problem
Thanks for your feedback