Low vision service provision in Scotland: review
Independent review of low vision service provision across Scotland carried out by NHS Education for Scotland.
Results
Data was gathered from March 2016-October 2016.
3.1 Response rate
Initially 105 potential providers were identified using the methods outlined above. Of these, there was a response rate of 76%. However, 21 of the non-respondents were optometry practices connected to a community scheme. The administrators of the schemes were contacted and provided grouped data for the schemes as a whole. A further 2 optometry practices and 2 specialist teachers did not respond.
Using the methods described above to identify services, there was difficulty establishing a list of specialist teachers. To that end, there may be an under-representation of this service type in this data set. However, it should be noted that this service type is specific to children, and as such are a distinct group from the other services (which provide the majority of services to those aged 16 and over).
3.2 Types of low vision service providers
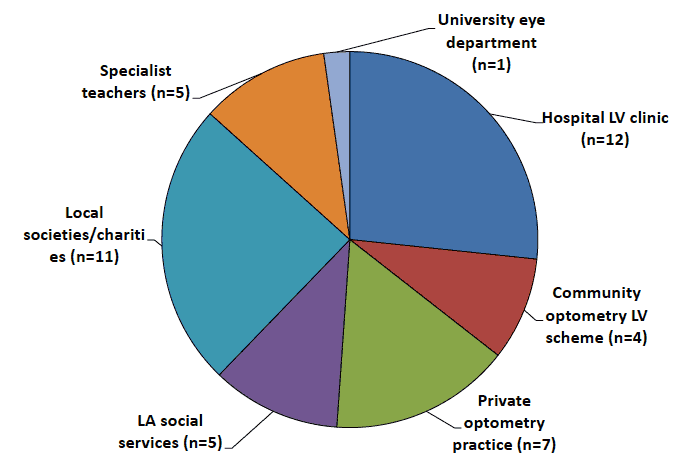
A total of 45 low vision service providers were identified (figure 1). Of these, four were community optometry low vision schemes, which include 54 optometry practices.
Figure 1: Low vision service providers in Scotland
3.3 Funding of services
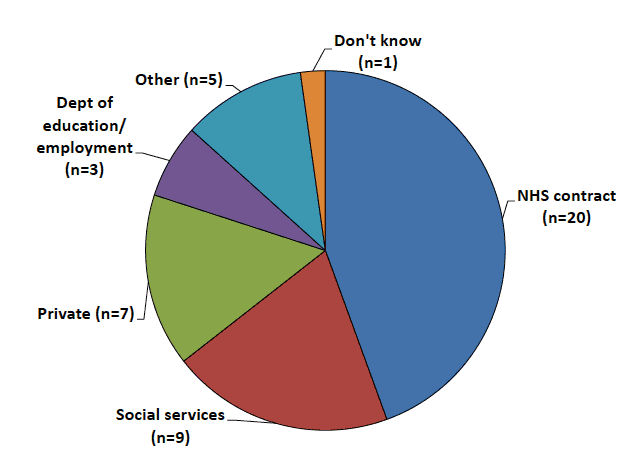
Funding of the services is from a variety of sources (see figure 2). Hospital clinics and community-based LV schemes are exclusively NHS funded. All the funding from the department of education (n=3) was all for specialist teachers, with these providers also receiving funding from NHS contracts and social services. The services included in the 'other' were local organisations and the university eye clinic.
Figure 2: Funding sources for low vision services
3.4 Geographical location of services
The distribution of low vision service providers throughout Scotland is illustrated in Figure 3. There is a distinct clustering of services in urban areas where population densities are highest, while rural regions are less well served.
The map also identifies the separate health boards, which are shaded to represent the percentage of people over pensionable age i.e. areas of darker shading have a higher proportion of older individuals. The prevalence of low vision increases with age, and therefore we can infer that areas shaded darker also have a higher proportion of people living with low vision. In Health Boards where there is a higher proportion of older people but the population is smaller, the number of service providers is relatively low e.g. Western Isles, Orkney, Dumfries & Galloway, Borders. Conversely, in areas of higher population density but a higher percentage of younger people, services are more available e.g. GGC, Lothian.
Figure 3: Map to show location of low vision service providers against percentage of individuals over pensionable age according to local health board boundaries ( ONS, 2014). Small spots indicate low vision provider locations.
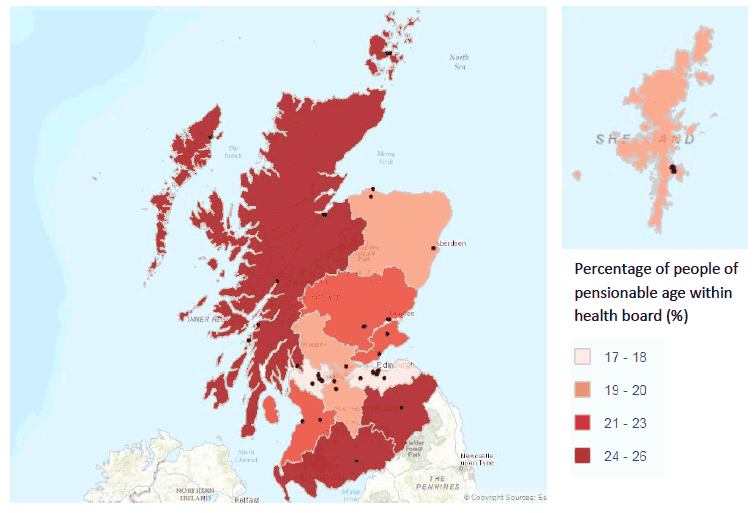
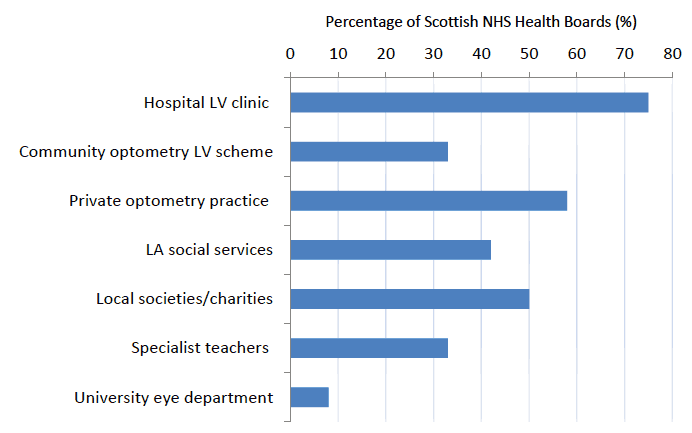
Figure 4 identifies that no service provider is represented within all 14 Scottish NHS Health Boards. The hospital service provides low vision assessments in 75% of the Health Boards (n=9). Of the five health boards with no direct hospital presence, three of the Boards have large community based low vision schemes in operation (Lanarkshire, Ayrshire & Arran, Fife). The other two Boards (Western Isles & Orkney) are served mainly by resource/sensory centres funded by the local authority social services. Both these Boards also have a private optometry services available.
Figure 4: Percentage of NHS Health Boards providing different types of low vision service
3.5 Capacity of services
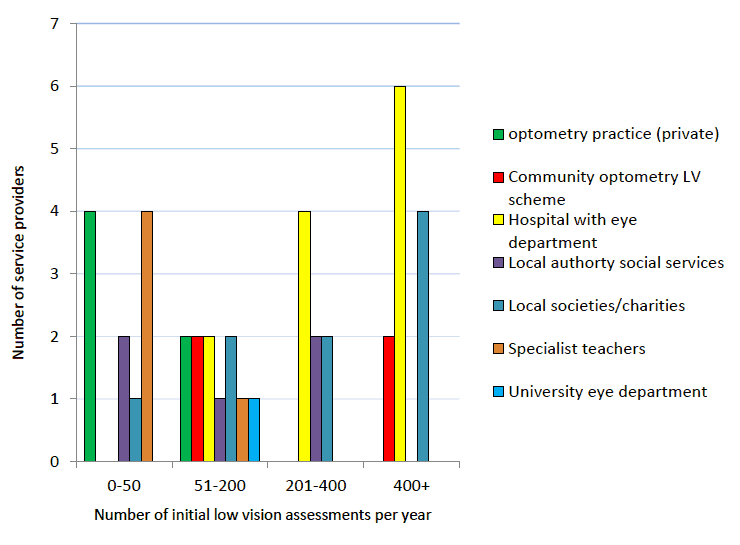
Figure 5 identifies the numbers of assessments (initial and review appointments) provided by each of the service providers within a 12 month period. The graph identifies that the services providing the largest number of assessments tend to be hospitals, community optometry low vision schemes and local societies/charities. It is important to note that whilst hospital and local societies/charities generally provide the service from one location, the community based service is provided via a group of optometry practices located throughout the health board.
Figure 5: Number of low vision assessments (including initial and review assessments) per year across low vision service providers in Scotland
3.6 Waiting times
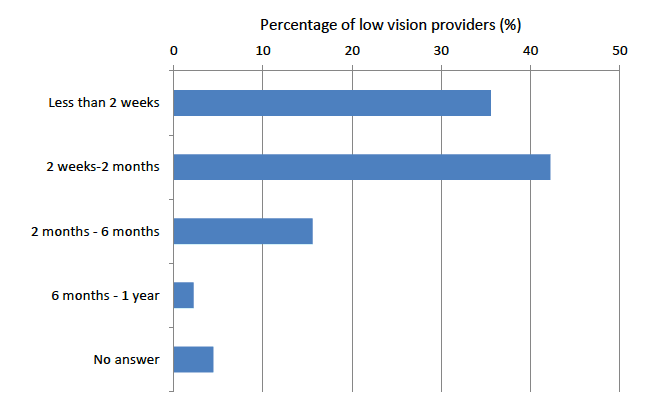
Figure 6 identifies the waiting times to access the service for an initial low vision assessment. All optometric services (private and community based schemes) had a waiting time of less than 2 weeks. Of the seven services with waiting times of 2 months - 6 months, five were hospitals with eye departments and two were local authority social services. One provider (specialist teacher) reported a waiting time of 6 months - 1 year.
Figure 6: Waiting times to access low vision service
3.7 Services provided to patients
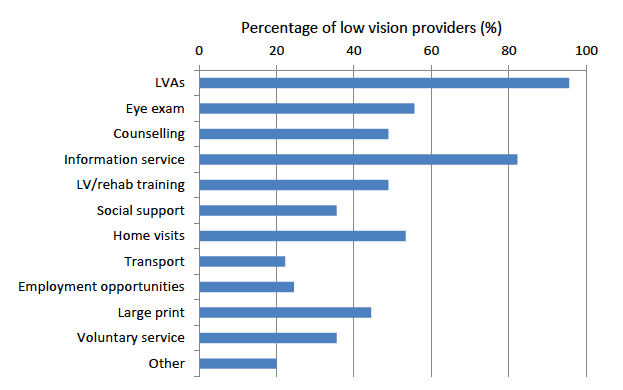
Figure 7 identifies the variability of services provided by the 45 low vision providers. All but two of the providers (local societies/charities) supply low vision aids.
Eye examinations are a feature of all optometry low vision providers and the majority of hospital services. Two hospital services reported not providing an ophthalmic or optometric eye examination, but these were both orthoptist led, and therefore it is possible that the orthoptist will check vision as part of the assessment. Eye examinations are reported in a small percentage of local societies/charities (n=3, 27%) and specialist teacher services (n=1, 20%), however they are not a feature of local authority social service provision.
Provision of counselling is mainly within the domain of local authority social services (n=4, 80%) and local societies/charities (n=6, 55%). This was reported as a feature in 50% of the hospital services and within one community based low vision scheme.
Provision of specialised low vision/rehabilitation training is provided by all local authority social services providers and the majority (91%) of local societies/charities. It was reported as a feature of 5 (42%) hospital services. However, it is not reported within any optometry practice based services.
Social support is also a feature of all local authority social services and the majority of local societies/charities (n=9, 82%). It is almost absent from all other service providers. This is similar to home visits, which are a feature of all local authority social services and the majority of local societies/charities (n=10, 91%). Home visits are also reported to be a feature of two of the community based optometry low vision schemes and two of the private optometric providers. Home visits are largely absent from hospital services.
Transport and employment opportunities were reported in less than 25% of service providers. Neither of these services were provided by optometric services.
Large print is mainly provided by local societies/charities, local authority social services and specialist teachers. Again, this service is not provided by optometric services.
Figure 7: Services provided to people with low vision
3.8 Low vision aid provision
3.8.1 Cost of low vision aids to patient
As previously identified, the majority of services supply low vision aids (96%) to the patient. Of these, two thirds of the providers supply the aids free-of-charge (on a loan basis) to the patient. Low vision aids are provided free-of-charge by all hospital providers, local authority social services and community based optometry low vision schemes. About half of the local societies/charities (45%) provide aids free of charge and the majority of specialist teacher providers (80%). However, both the private optometry practices and the university eye department do not supply aids free-of-charge.
Of those providers who supply low vision aids free-of-charge, 20% (n=6) have a maximum policy on the number of aids provided to the patient. This included one local authority social services, two local societies/charities, one specialist teacher and two community based optometry low vision schemes.
3.8.2 Types of low vision aids
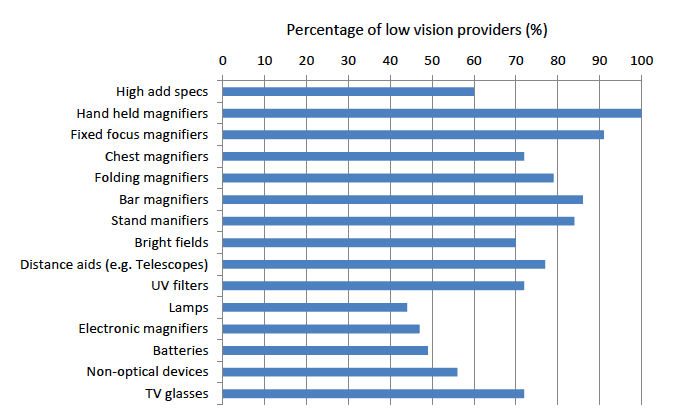
Figure 8 identifies the variety of the low vision aids provided across the services (n=43). Hand held magnifiers are common to all providers, and all other optical low vision aids available in over 70% of all the services.
High reading addition spectacles were available from all community optometry LV schemes, private optometrists and university eye clinic services - which are all optometrist led services. The hospitals also reported providing these in 75% of services. However, they were less frequently provided from the other services, maybe due to the lack of a prescribing optometrist.
Less than 50% of the providers reported offering lamps and electronic aids. Lamps are least likely to be provided by hospital (n=0) and community optometry LV schemes (n=1, 25%), and are more commonly provided by local societies/charities (n=7, 64%). Similarly, electronic aids are less likely to be provided by hospital services (n=2, 17%) and community optometry LV schemes (n=1, 25%), and more common within local authority/social services (n=3, 60%), specialist teachers (n=3, 60%) and local societies/charities (n=6, 55%).
Local authority social services and local societies/charities also provide a large proportion of non-optical devices, 100% and 91% respectively. These are not reported as provided in any of the hospital services.
Figure 8: Percentage of different types of aids provided across all low vision providers in Scotland
3.9 Referral pathways
3.9.1 Referral routes into low vision service provision
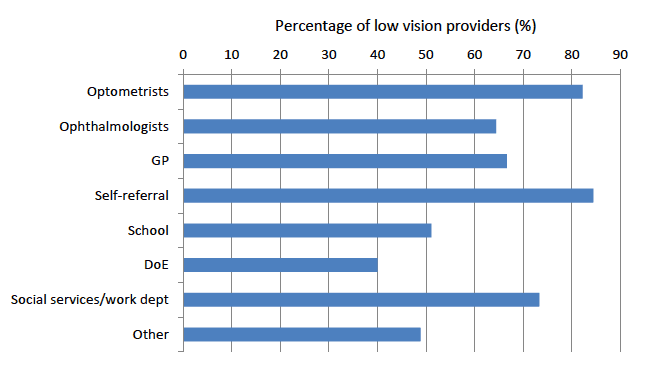
Figure 9 identifies that there are a range of referral routes into low vision services. Self-referral is a common route for referral into a service, with only a proportion of hospital services (42%) and specialist teachers (40%) not reporting this as an option. Apart from the university eye clinic, which identified optometrist and self-referral as the only referral routes, all other referral routes were identified for a proportion of all other providers.
Figure 9: Referral routes for people with low vision into a service
3.9.2 Referral routes beyond the low vision assessment
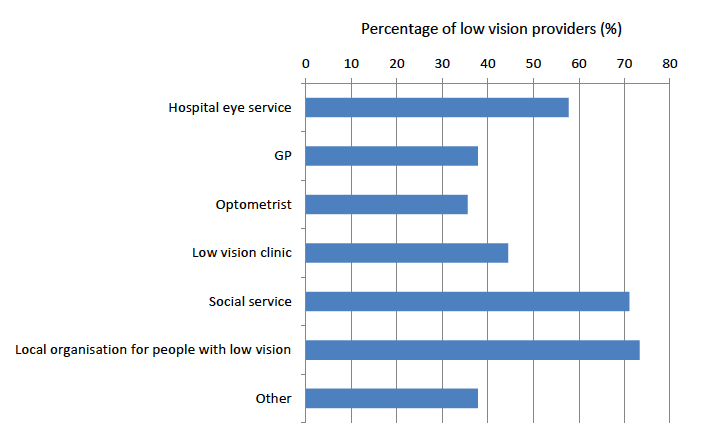
Following a low vision assessment, figure 10 identifies that there are a range of possible referral routes.
Referral to low vision clinics was reported in the majority of local authority social services (80%), local societies/charities (82%) and specialist teachers (80%). Both local authority social services and local societies/charities also reported referral to the optometrist as a possible referral route in the majority of services, 80% and 82% respectively.
A proportion of all service providers reported referral to social services and local organisations as an option.
Figure 10: Referral routes following low vision assessment
3.10 Screening for depression
Five service providers (11%) screen for depression (hospital eye department n=1, private optometry practice n=1, local authority social services n=1, local society/charity n=1, community optometry low vision scheme n=1). Of these five services, only one screened for depression using a screening tool (local society/charity), however the provider was unable to identify the tool used.
Contact
Email: Liam Kearney
Phone: 0300 244 4000 – Central Enquiry Unit
The Scottish Government
St Andrew's House
Regent Road
Edinburgh
EH1 3DG
There is a problem
Thanks for your feedback