Scottish Budget - Draft Budget 2017-2018 devolved taxes methodology report
Report detailing the methodologies used for the devolved tax forecasts.
Chapter 3 - Macroeconomic Forecasts Underpinning the Income Tax Forecasts
Economic forecasts overview
This chapter provides a summary of the process for creating the economic determinants of income tax forecasts in Chapter 4.
The Scottish Fiscal Commission has deemed the Scottish Government's forecasts of non-saving, non‑dividend income tax, which are underpinned by these economic forecasts, to be reasonable.
The forecasts contained in this paper use statistics published up to the 21 st November 2016.
Overview of the forecasting process
The economic forecasting process is primarily focused on creating forecasts of earnings and employment to feed into income tax forecasts. This requires broader forecasts of the Scottish economy to produce the underlying assumptions which will determine the growth in earnings and employment.
The Scottish Government's macroeconometric forecasting model, known as " SGGEM", is central to the forecasting process. SGGEM was built by the Scottish Government and the National Institute of Economic and Social Research ( NIESR), an economic research institute. SGGEM uses extensive Scottish and global historic economic data to project a pathway for the Scottish economy. It is underpinned by NiGEM, NIESR's global macroeconomic model, which is used by a large number of organisations including the OECD, the Bank of England and the European Central Bank.
Whilst SGGEM is central to the forecasting process, it is adjusted in a number of ways using what is known as "off‑model" analysis - bespoke econometric models and expert user judgement based on available evidence and external projections.
Because the UK is Scotland's largest trading partner, and Scotland is part of the UK monetary system, the UK has an important role in determining the path of the Scottish economy. The Office for Budget Responsibility's ( OBR's) forecast for the UK economy published alongside the Autumn Statement 2016 is used to fix the path of the UK economy in SGGEM. This achieves a degree of coherence between the Scottish Government's forecasts of Scotland's economic performance and the OBR's forecasts of the UK. Key UK-wide variables, such as interest rates and inflation, are also fixed within SGGEM to the OBR's forecasts. This means that many of the OBR's assumptions around the impact of the EU Referendum outcome are implicitly included in the Scottish Government's forecasts.
Scottish forecasts
This section sets out the methodology used to produce the Scottish economic forecasts. All forecasts are presented on a financial year basis as this is the time period over which the Scottish Government's income tax forecasts must be made.
The forecasts provide an indication of the future direction of the Scottish economy based on the information currently available about the state of the economy, its historic performance, and a series of assumptions about the future direction of individual components of the economy. However, economic forecasts are always subject to uncertainty and a margin of error. The result of the EU referendum and current uncertainty about the future relationship between the UK and the EU greatly increases the level of uncertainty within these forecasts. The process and outcome of UK negotiations with the EU could result in growth being either higher, or lower, than forecast.
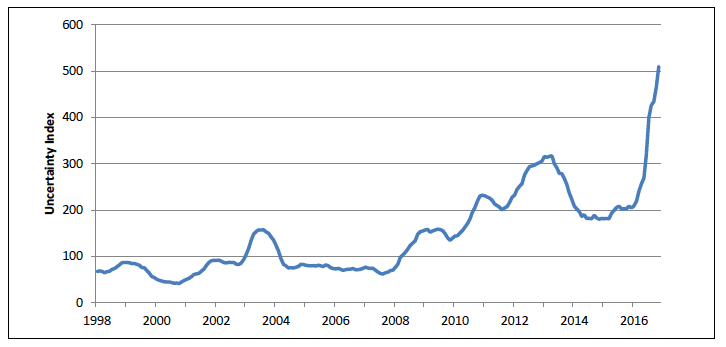
This increase in uncertainty is highlighted in a number of economic indicators. For example, recent measures, based on UK media reports suggest that economic uncertainty is currently at historically high levels, as summarised in Chart 1 below.
Chart 1: UK Economic Policy Uncertainty Index: 12 Month Moving Average
Source: Source: "Measuring Economic Policy Uncertainty" by Scott R. Baker, Nicholas Bloom and Steven J. Davis ( www.PolicyUncertainty.com).
Short term outlook for the Scottish economy
Recent GDP growth has been below trend in Scotland. This has been due to two main factors. Firstly, global economic growth has been relatively subdued, affecting growth in Scottish exports. Secondly, the fall in oil prices which occurred in 2015 has reduced investment in the North Sea and resulted in oil and gas operators cutting costs. This has reduced activity across the sector and has fed through to a slowdown in the wider Scottish economy. This has been reflected in the latest GDP statistics, with the Scottish economy growing by 0.3% in the first half of 2016.
This slowdown in the oil and gas sector is expected to continue in the short term, with below trend growth forecast for 2016-17 as a whole. However, there are indications that the oil and gas sector may be approaching its nadir. A review by PwC suggests that globally, companies are increasingly reporting that the industry has reached the bottom of the cycle. [8] In Scotland, the Aberdeen and Grampian Chambers of Commerce's 25 th Oil and Gas Survey found that around two-thirds of firms felt that the sector was nearing the bottom of the cycle, with around half of these feeling that the bottom had already been reached. [9] The latest labour market data also provide tentative signs that the industry may be stabilising. After reaching an historic low of 0.8% in December 2014, claimant count unemployment in Aberdeen and Aberdeenshire increased steadily to 1.9% in August 2016. However, it has since fallen in both September and October 2016, the first time that there have been two successive monthly falls since December 2014.
Looking forward, future economic growth will be affected by the impact of the EU Referendum result (see Box 1 overleaf). The short term impact of this is modelled through four key channels, as summarised below.
- The depreciation of sterling pushes up inflation, which in turn depresses real wages and, coupled with an increase in economic uncertainty, depresses consumption.
- Increased economic uncertainty delays or suppresses business investment.
- Lower economic growth in the rest of the UK, Scotland's largest trading partner, reduces intra- UK trade.
- This is partly offset by the depreciation in sterling providing a boost to Scotland's international exports.
Longer term outlook for the Scottish economy
To forecast the Scottish economy over the longer term, an estimate of Scotland's potential level of GDP is needed. Given the size of Scotland's labour force and levels of productivity, it is possible to produce a certain amount of goods and services in any one year. However, the actual amount of goods and services that Scotland produces in any one year will vary around this hypothetical level of potential as the economy cycles through stronger and weaker growth in demand. The difference between actual GDP in any one year and potential output is known as the output gap.
Given the Scottish Government's estimates of potential output in Scotland, the output gap in Scotland is estimated to have been around -0.6% in 2015-16, that is, GDP is below its potential level. This gap implies that some labour and capital is being underutilised, and that Scotland could see faster growth over the longer term forecast horizon as it catches up with its potential level of GDP.
Box 1: Impact of the EU referendum result on forecasts of the Scottish economy
The OBR's central forecast assumes that the UK leaves the EU in April 2019. They do not model a specific post-exit trading regime. Instead, they assume that the negotiation of new trading arrangements with the EU and other countries slows the pace of import and export growth in future years. The OBR further assume that the UK adopts a tighter migration regime, resulting in net migration being lower than would otherwise be the case. In addition, they have reduced their assumption about trend productivity growth, and in turn potential output growth, to reflect the cumulative impact of reductions in openness, investment and R&D, and net inward migration that the EU referendum result is expected to trigger.
The same medium term assumptions have been adopted in the forecasts below. This ensures that the key elements which feed into the Scottish budget process - the Block Grant Adjustment (which uses OBR forecasts) and the Scottish income tax forecast (using Scottish Government forecasts) - are based on the same expectations of the impact of the EU referendum.
The impact of the EU referendum result is imposed on the forecast in a number of ways.
1. The SGGEM model captures some aspects of uncertainty through the risk premia in the model. This is the additional return investors demand on capital due to increased risk, which feeds through to real effective interest rates. Risk premia are adjusted in line with historic episodes of uncertainty.
2. The productivity assumption underpinning growth in potential output is aligned with the OBR's forecast. The OBR's forecast of productivity growth has been reduced due to the impacts of the EU referendum result.
3. The OBR use the principal population projection to project the UK population rather than the high migration variant, to reflect lower than expected population growth as a result of the EU referendum result. The principal population projection for Scotland is also used in the Scottish forecast.
4. The OBR make judgements about the likely pathway of key variables such as investment and consumption in light of the EU referendum result, projecting softer growth in these. The Scottish Government forecast reflects similar impacts in Scotland on consumption and investment using judgement based on the available evidence.
The level of potential output in Scotland will grow over time as the population grows and productivity increases. Potential output is determined by population, labour force, average hours worked and productivity. In estimating potential output, the following assumptions are used:
- The ONS's principal population projection is used to project the size of Scotland's population in future years.
- Available labour market data shows different trends in labour market participation rates by age groups. These trends within each age group are projected to continue over the forecast horizon, and when combined with population projections on the relative size of each age group over time, create a projection of the Scottish labour force.
- A projection of average hours worked in Scotland is created by disaggregating hours worked into part-time and full-time work. There was a shock to the share of the labour force working part-time following the 2008 recession which is gradually unwinding, with working hours returning to previous levels. Projecting the share of full-time vs part-time work, with projected trends for average hours worked in each group, creates a forecast of average hours worked for all those in employment.
- A projection of Scottish potential productivity, i.e. potential output per hour worked, is required. Given the current uncertainty for the outlook for productivity, and the close historical relationship between Scottish and UK productivity, the OBR's forecast of productivity is used to project productivity in Scotland. Adopting this assumption also means the OBR's assumption about the impact that leaving the EU will have on productivity is implicitly included in the forecast of potential output presented in this paper (see Box 1).
Combining all these elements creates a projection of Scottish potential output.
Forecasts of Scottish GDP and components
The total value of GDP - i.e. the size of the economy - is made up of household consumption of goods and services, investment by firms and households, government spending and trade - imports and exports. Each of these components is modelled separately to build up a forecast of GDP, as summarised in Chart 2 below.
Chart 2: Annual GDP growth (%) and contributions by component
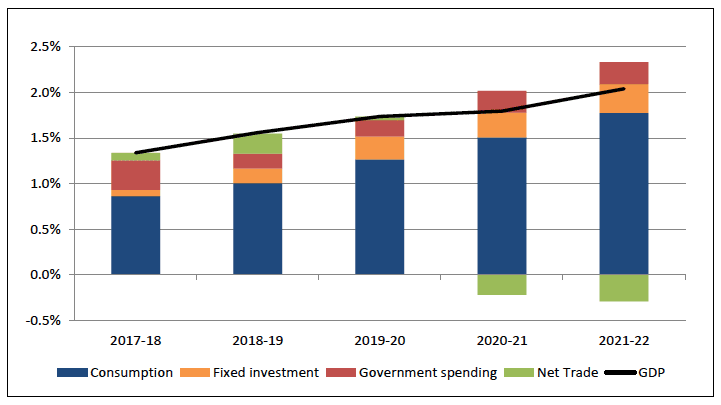
Household Consumption is determined by real disposable household income, which is in turn determined by changes in real wages and employment, and the decision of households about whether to spend or save. Growth in household consumption is expected to be below trend over the forecast horizon. This is primarily driven by the uncertainty created by the referendum result, as well as rising inflation eroding real wage growth, and in turn suppressing growth in consumption over the forecast horizon.
Government spending is fixed based on Scottish Government and UK Government spending plans as set out in the Autumn Statement. With the UK Government planning further fiscal consolidation over the forecast period, government spending is expected to make a smaller contribution to economic growth in the coming years than it has done historically.
Fixed investment is made up of business investment in, for example, plant and machinery, and business and household investment in the housing stock. Incentives to invest are affected by the potential returns to investment, uncertainty, and the cost of investment, including interest rates and taxes. Investment is expected to be weaker over the forecast horizon, and in particular in 2017-18 than it has been historically. This is because the confidence shock caused by the referendum result is assumed to increase the risk premia on investments [10] . When combined with weak domestic and external demand, this is likely to constrain growth in investment in the early years of the forecast. Beyond 2019-20, growth in investment starts to return to historic trends.
Scottish net trade is expected to be supportive of economic growth in 2017-18 and 2018-19 as growth in exports exceeds growth in imports. This is as a result of the depreciation of Sterling making imports relatively more expensive and Scottish exports relatively cheaper. As can be seen in Chart 2, from 2020-21 net trade turns slightly negative, in line with its historic contribution to GDP growth, as the positive effect of the sterling depreciation on exports diminishes. The above projections make no assumptions about the long run impact of the UK leaving the EU on Scottish trade except a judgement that growth in international exports are likely to be somewhat weaker than historically. Forecast growth in exports is also affected by slower growth in the rest of the UK, Scotland's largest export market.
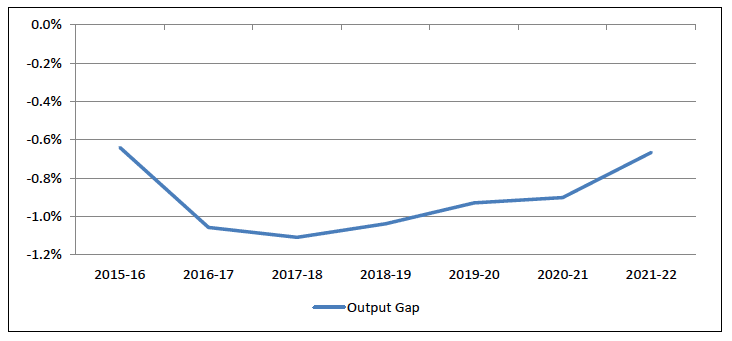
Chart 3 shows the pathway of the output gap over the forecast horizon. As discussed above, the output gap is estimated to be around -0.6% in 2015-16 due to recent weakness in the Scottish economy. Continuing weakness in consumption and investment in the Scottish economy then causes the output gap to become more negative in 2016-17 and 2017-18. The output gap then starts to close over the forecast horizon.
Chart 3: Pathway of the Scottish output gap as a percentage of potential output
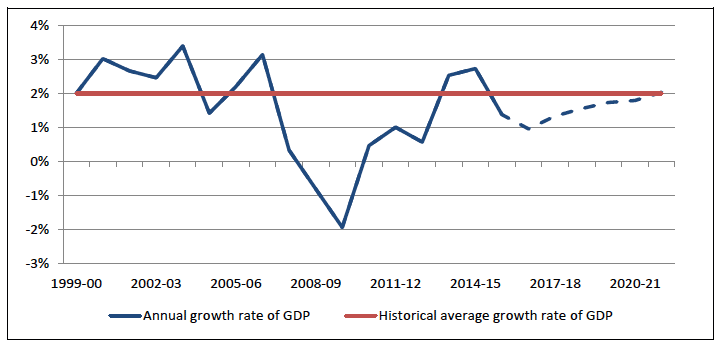
Bringing the above together, the forecasts of Scottish GDP are shown in Table 8. Historically, Scottish GDP has grown by around 2% per year. The forecasts for Scotland show growth is expected to be below this 2% trend over the next two years as the impact of Brexit depresses economic activity. GDP growth is then forecast to gradually return to trend by 2021-22.
Table 8: Economic forecast (% change on previous financial year)
| 15-16 | 16-17 | 17-18 | 18-19 | 19-20 | 20-21 | 21-22 | |
|---|---|---|---|---|---|---|---|
| Headline GDP | Outturn | Forecast | |||||
| GDP | 1.4 | 1.0 | 1.3 | 1.6 | 1.7 | 1.8 | 2.0 |
| Output GDP (% of GDP) | -0.6 | -1.1 | -1.1 | -1.0 | -0.9 | -0.9 | -0.7 |
| GDP per capita | 1.1 | 0.7 | 1.0 | 1.3 | 1.4 | 1.5 | 1.7 |
| Components of GDP | |||||||
| Domestic demand | 3.8 | 0.7 | 1.3 | 1.2 | 1.6 | 1.8 | 2.1 |
| Household Consumption | 2.3 | 1.7 | 1.6 | 1.5 | 1.9 | 2.2 | 2.6 |
| Government Consumption | 1.1 | 0.2 | 1.5 | 0.3 | 0.3 | 0.6 | 0.7 |
| Fixed Investment 1 | 10.9 | 1.5 | 0.9 | 1.5 | 2.1 | 2.1 | 2.2 |
| Exports | -0.6 | -0.1 | 2.2 | 2.2 | 1.8 | 1.5 | 1.4 |
| Imports | 3.1 | 1.2 | 1.7 | 1.5 | 1.5 | 1.6 | 1.7 |
1 Fixed investment is sum of business investment, housing investment, and government investment
Chart 4 shows the projected pathway of Scottish GDP growth in the context of its historic growth rate.
Chart 4: Historic and forecast annual growth rate (%) of Scottish GDP
The Scottish labour market
A forecast of the Scottish employment level is required as a determinant for the forecast of income tax liabilities in Scotland. The forecast of employment in Scotland starts with projections of the Scottish 16+ population from the ONS principal population projections. A projection of labour market participation is then created to provide a projection of the size of the Scottish labour force. [11]
Given the projected size of the Scottish labour force, the pathways of employment and unemployment are forecast based on movements in the wider economy.
Over recent years, the Scottish labour market has been more resilient than may have been expected given the depth of the 2008 recession. Labour market participation and employment have grown whilst unemployment has been relatively low and stable since 2013. However, the Scottish labour market has been volatile during 2016. The latest data, covering the period July - September 2016, show the unemployment rate now at 4.7%, close to its lowest level since 2008, and down from 6.1% at the beginning of the year. This has been driven by a combination of rising employment and a fall in labour market participation.
The size of the Scottish labour force is projected based on long term trends in participation by age group, population changes and demographic changes. The projection of the Scottish 16+ labour force is presented in Chart 5. This forecast takes into account the impact of recent falls in participation but assumes a gradual return to the longer term trend projections over the forecast horizon.
Chart 5: Projections of the Scottish (16+) labour force (thousands)
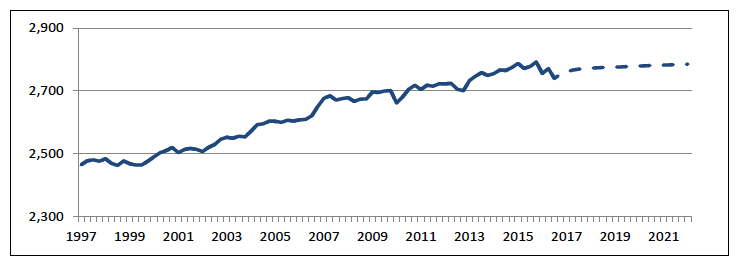
This projection is for lower growth in the Scottish labour force than has occurred historically. This is due to the underpinning population and demographic projections, with a shift in the Scottish population to those aged over 65, who are less likely to participate in the labour market.
Once a projection of the Scottish labour force is produced, employment and unemployment are modelled based on movements in the broader economy. Over the forecast horizon, as the economy returns to trend, we expect the Scottish unemployment rate to return to its trend rate, often referred to as the " NAIRU" (non-accelerating inflation rate of unemployment). This is the rate of unemployment sustainable without firms starting to struggle to find people to employ putting excess upwards pressures on wages. Based on Scottish Government analysis and comparing to the OBR's estimate for the UK, the NAIRU in Scotland is estimated to be around 5.4%. This should not be viewed as a floor on unemployment in Scotland. Unemployment can be below the NAIRU as the economy goes through cycles. The NAIRU itself can also fall over time, for example in response to changes in working practices or government policies.
Charts 6 and 7 overleaf present forecasts of Scottish unemployment and employment respectively.
Chart 6: Scottish unemployment rate (%), historic and forecast
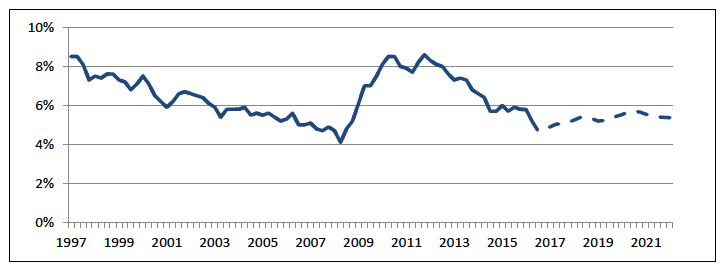
Chart 7: Scottish historic and future forecast employment level (thousands)
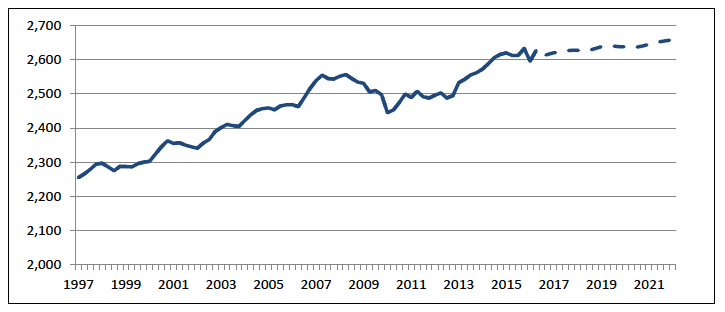
The employment level is expected to grow in every year of the forecast, albeit at a slower rate of growth than historically. This is due in part to slower projected growth in the labour force. The level of employment is expected to be around 40,000 higher in 2021-22 than it was in 2015-16. In the later years of the forecast, employment growth starts to increase more rapidly as participation increases, unemployment falls and economic growth picks up as shown in Table 9.
Despite increasing employment over the forecast period, unemployment is forecast to rise. This is due to the size of the Scottish labour force growing more quickly than the number of people in employment. It primarily reflects an increase in the number of people assumed to move from economic inactivity back into the labour market to look for work, rather than individuals moving from employment to unemployment.
Table 9: Labour Market Forecast (% change on previous financial year)
| 15-16 | 16-17 | 17-18 | 18-19 | 19-20 | 20-21 | 21-22 | |
|---|---|---|---|---|---|---|---|
| Outturn | Forecast | ||||||
| Total Population (thousands) | 5,364 | 5,380 | 5,396 | 5,411 | 5,428 | 5,445 | 5,462 |
| Labour Force (thousands) | 2,774 | 2,753 | 2,768 | 2,780 | 2,789 | 2,798 | 2,806 |
| Employment (thousands) | 2,614 | 2,618 | 2,626 | 2,632 | 2,639 | 2,640 | 2,655 |
| Unemployment (%) | 5.8 | 4.9 | 5.1 | 5.3 | 5.4 | 5.6 | 5.4 |
Scottish wages
As discussed in Box 2 below, growth in Scottish and UK wages have historically been closely correlated, even when differences in economic performance are observed at the aggregate level. Scottish wages are therefore assumed to grow in line with the corresponding OBR forecasts for the UK as a whole. In the initial period of the forecast, this approach is supplemented with additional modelling and forecasting to include any short run shocks to Scottish wages. This relies on surveys and other timely data of the Scottish and UK economies.
Scottish and UK nominal wages tend to grow in a similar way. Historically, the annual growth rates have been very close. This is shown in Charts 8 and 9 in Box 2 below.
Box 2: Correlation of Scottish and UK nominal wage growth
Chart 8: Mean gross hourly full-time wages (£/hour)
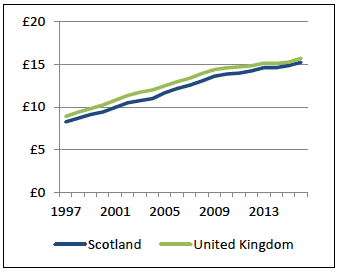
Chart 9: Mean gross hourly FT wages growth rate (%)
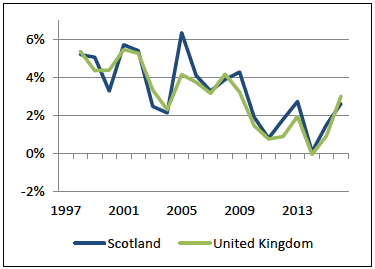
Source: Annual Survey of Hours and Earnings. There is a discontinuity in the time series ASHE data around 2005 creating some volatility in the series.
The growth rate of nominal wages in Scotland and the UK are highly correlated, having a correlation coefficient of over 0.9 (where 1 is perfectly correlated and 0 is no correlation). Given the strong historic relationship between Scottish and UK wages, the growth rate of Scottish average nominal hourly wages is projected in line with the OBR's forecast for the UK.
The forecasts summarised in Table 10 assume that growth in nominal wages returns to its historic trend. However, the increase in inflation expected in the coming years means that growth in real wages, and therefore households' purchasing power, remains subdued.
Table 10: % Wages and earnings forecast (change on previous financial year)
| 15-16 | 16-17 | 17-18 | 18-19 | 19-20 | 20-21 | 21-22 | |
|---|---|---|---|---|---|---|---|
| Outturn | Forecast | ||||||
| Nominal wages 1 | 2.3 | 2.3 | 2.2 | 2.9 | 3.6 | 4.0 | 4.1 |
| Inflation | 0.3 | 1.5 | 2.4 | 2.4 | 2.1 | 2.0 | 2.0 |
| Real wages 2 | 2.1 | 0.8 | -0.1 | 0.5 | 1.5 | 2.0 | 2.0 |
| Average hours worked per week | -1.2 | 0.0 | 0.1 | 0.1 | 0.0 | 0.0 | 0.0 |
| Average annual earnings 3 | 1.1 | 2.3 | 2.3 | 2.9 | 3.6 | 4.1 | 4.1 |
1 Nominal wages growth is growth in average hourly earnings per worker
2 Real wages are calculated by deflating the nominal wage with the consumer expenditure deflator
3 Average earnings growth is growth in total annual earnings. Growth from 2016-17 onward is a determinant in the income tax forecast
Contact
There is a problem
Thanks for your feedback