Scottish greenhouse gas emissions annual target report: 2015
This is a report required under the Climate Change (Scotland) Act 2009. It provides detail on the annual climate change emissions reduction targets.
Part 3 - Net Scottish Emissions Account (NSEA) for 2015
Requirements of the Act
Section 34 of the Act requires that the report:
- state the amount of the net Scottish emissions account for the target year (subsection (3)(a) [20] ).
- state the proportion of the reduction in the net Scottish emissions account which is accounted for by reductions in net Scottish emissions (subsection (3)(b)).
- state the total amount of carbon units:
- that have been credited to or debited from the net Scottish emissions account for the target year (subsection (3)(c)(i));
- that have been purchased in the target year (subsection (3)(c)(ii));
- that have been held and not surrendered in the target year (subsection (3)(c)(iii)).
- give details of the number and type of those carbon units (subsection (3)(d)).
- for each year in the period 2011-2050 [21] .
- state the amount of the NSEA for each preceding target year (subsection (5)(a));
- state the cumulative amount of the net Scottish emissions account for the target year and all preceding target years (subsection (5)(b)).
Amount of the Net Scottish Emissions Account for 2015
Achievement of Scotland's greenhouse gas emissions targets is measured against the level of the net Scottish emissions account ( NSEA). The NSEA is defined in the Act as the aggregate amount of "net Scottish emissions" of greenhouse gases, reduced / increased by the amount of carbon units [22] credited to / debited from it in accordance with the Carbon Accounting Scheme Regulations made under the Act [23] .
Table 4 provides the amount of the net Scottish emissions account in 2015, including the total amount of carbon units that have been credited to or debited from the NSEA as the result of the operation of the EU ETS in Scotland.
Table 4: Net Scottish Emissions Account for 2015 ( tCO 2e) [24]
| Greenhouse Gas Inventory |
Net Scottish emissions - see table 2 (C) |
48,051,092 |
|---|---|---|
| Carbon Units |
Number of units to be credited to (+ value) or debited from (- value) the NSEA - see table 6 (D) |
2,546,649 |
| NSEA |
C - D |
45,504,443 |
Based on the NSEA, Scotland's emissions increased by 1.8 per cent in 2015 on the previous year. The longer term trend to date shows a reduction of 41.0 per cent from the 1990/1995 baseline period.
Proportion of the reduction in the net Scottish emissions account which is accounted for by reductions in net Scottish emissions
Section 8 of the Act places a duty on the Scottish Ministers to ensure that reductions in net Scottish emissions of greenhouse gases account for at least 80 per cent of the reduction in the net Scottish emissions account in any target year - the "domestic effort target". In effect, this ensures that the majority of the action to meet emission reduction targets is taken domestically, rather than by offsetting domestic emissions through the purchase of international credits.
There are two mechanisms by which carbon units can be credited to / debited from the NSEA.
i As the result of the operation of the EU Emissions Trading System ( EU ETS) in Scotland. The details of this mechanism are set out in the Annex to this report.
ii. Ministers may credit to the NSEA any international carbon units purchased by them, thereby offsetting domestic emissions. The Climate Change (Limit on Carbon Units) (Scotland) Order 2011 [25] sets limits for the period 2013-2017 which allows Ministers the option to purchase (credit) up to 206,000 carbon units in 2015 in addition to credits or debits to the Scottish account through the operation of the EU ETS.
For the specific purpose of ascertaining whether the domestic effort target has been met, the Act stipulates that the use of carbon units through the operation of the EU ETS is treated as though it is a reduction in "net Scottish emissions".
For the purposes of the domestic effort target in 2014 and 2015, the net Scottish emissions and net Scottish emissions account are the same. This is because no units were credited to the NSEA in either of the years as a result of the purchase of international carbon units. This means that the change in net Scottish emissions of greenhouse gases account for 100 per cent of the change in the net Scottish emissions account in the 2015 target year (see Table 5).
Table 5: Change in net Scottish emissions (including the operation of the EU ETS) between 2014 and 2015 as a proportion of the change in the Net Scottish Emissions Account between 2014 and 2015 [26]
| Target Year |
Net Scottish Emissions [27] |
Net Scottish Emissions Account |
Proportion of the change in the NSEA which is accounted for by changes in Net Scottish emissions |
|---|---|---|---|
| 2014 |
44,696,804 |
44,696,804 |
100% |
| 2015 |
45,504,443 |
45,504,443 |
|
| Change between 2014 and 2015 |
+807,638 |
+807,638 |
Carbon Units credited or debited to the NSEA
Table 6 sets out the effect of the EU ETS on the NSEA in 2015. Further detail on this mechanism are set out in the Annex to this report.
Table 6: The effect of the EU ETS on the Net Scottish Emissions Account in 2015 ( tCO 2e)
| Total amount of units surrendered from fixed installations [28] |
15,131,603 |
|---|---|
| Estimate of surrendered CO 2 emissions from domestic aviation |
506,672 |
| Estimate of surrendered CO 2 emissions from international aviation |
1,302,798 |
| Total estimate of surrendered emissions (E) |
16,941,073 |
| Fixed installations cap |
13,029,411 |
| Domestic aviation cap |
443,255 |
| International aviation cap |
921,758 |
| Total 2015 EU ETS cap ("Specified Amount") for Scotland (F) |
14,394,424 |
| Number of units to be credited to (+ value) or debited from (- value) the Net Scottish Emissions Account (E - F) [29] [30] |
2,546,649 [31] |
Table 7 sets out carbon units which have been purchased, and carbon units which have been held and not surrendered.
Table 7: Total amount of carbon units which have been purchased, and those that are held and not surrendered, 2015
| Number of Units |
Type of Units |
|
|---|---|---|
| Number of carbon units purchased |
0 |
Not applicable |
| Number of carbon units held and not surrendered |
0 |
Not applicable |
| Amount of carbon units credited to the Net Scottish Emissions Account |
0 |
Not applicable |
Amount of the NSEA for each preceding target year and cumulative amount of the net Scottish emissions account for the target year
Table 8 sets out the amount of the net Scottish emissions account for the target year and each preceding target year based on the 1990-2015 greenhouse gas inventory. Table 8 also states the cumulative amount of the net Scottish emissions account for the target year.
Table 8: Amount of the Net Scottish Emissions Account for each target year, and the cumulative amount of the Net Scottish Emissions Account for the target year ( tCO 2e)
| Target Year 2010 |
60,780,578 |
|---|---|
| Target Year 2011 |
58,463,949 |
| Target Year 2012 |
59,138,499 |
| Target Year 2013 |
50,491,177 |
| Target Year 2014 |
44,696,804 |
| Target Year 2015 |
45,504,443 |
| Cumulative 2010-2015 |
319,075,450 |
Adjustments to net Scottish emissions account for earlier target years and cumulative amount of the net Scottish emissions account for all preceding target years
Table 9 contains data on revisions to previously reported estimates of the NSEA for earlier target years, together with the revised amount and reason for any revision. These represent revisions to estimates reported in the 2014 Annual Target Report for the 1990-2014 inventory. Revisions to the NSEA arising from previous inventory reports is available in previous annual target reports [32] .
Table 9: Revisions to Net Scottish Emissions Account for earlier target years [33] ( tCO 2e)
| Target year |
Net Scottish Emissions Account estimate reported in 2014 Annual Target Report [34] |
Revision required |
Revised Net Scottish Emissions Account estimate |
|---|---|---|---|
| FOR THE 1990-2015 INVENTORY |
|||
| 2010 |
57,980,025 |
+ 2,800,554 |
60,780,578 |
| 2011 |
55,219,648 |
+ 3,244,301 |
58,463,949 |
| 2012 |
55,564,609 |
+ 3,573,890 |
59,138,499 |
| 2013 |
47,885,327 |
+ 2,605,850 |
50,491,177 |
| 2014 |
41,885,736 |
+ 2,811,068 |
44,696,804 |
REASON FOR REVISION. This follows similar revisions to the net Scottish emissions as described in Part 2 of this report, and described in more detail in the Official Statistics Release Scottish Greenhouse Gas Emissions 2015 [35] .
Table 10 shows the revisions to the cumulative amounts of greenhouse gas emissions for preceding target years.
Table 10. Revisions to Cumulative Amounts in Preceding Target Years. All Values in tCO 2e
| TARGET YEAR |
Cumulative Amount previously reported |
Revision required |
Revised Cumulative Amount (G) |
Net Scottish Emissions Account for the Target Year (H) |
New Cumulative Amount (G + H) |
|---|---|---|---|---|---|
| 2010 |
Not Applicable |
Not Applicable |
Not Applicable |
54,713,907 |
54,713,907 |
| 2011 |
54,713,907 |
+1,178,969 |
55,892,876 |
54,251,910 |
110,144,787 |
| 2012 |
110,144,787 |
+2,441,212 |
112,585,998 |
55,665,180 |
168,251,178 |
| 2013 |
168,251,178 |
+7,845,364 |
176,096,542 |
49,724,807 |
225,821,349 |
| 2014 |
225,821,349 |
-9,171,741 |
216,649,608 |
41,885,736 |
258,535,344 |
| 2015 |
258,535,344 |
+15,035,663 |
273,571,007 |
45,504,443 |
319,075,450 |
Chart 2 shows the impact of successive revisions to the inventory on the Net Scottish Emissions Accounts for the each of the Target Years from 2010 to 2014.
It also shows the Net Scottish Emissions Account in 2015.
Chart 2. Impact of successive revisions to the inventory on the Net Scottish Emissions Accounts for each of the Target Years from 2010 to 2014, and the Net Scottish Emissions Account in 2015. Values in MtCO 2e
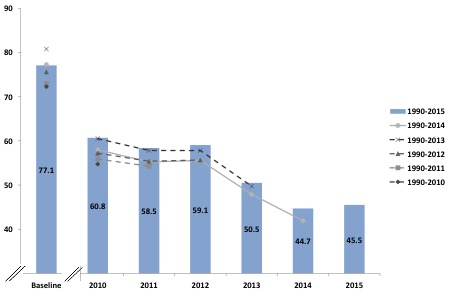
The fixed annual targets for 2010-2027 were set on the basis of the 1990-2008 inventory, which was the latest inventory available at the time. This estimated baseline emissions to have been 70.201 MtCO 2e and the 2020 target was set at 40.717 MtCO 2e, which equated to a 42 per cent reduction in line with the level of the 2020 interim target set by the Act. Successive revisions means that the reductions required to meet each of the fixed annual targets are now significantly greater than was envisaged when the targets were set. So, for example, to reach the 2020 annual target now equates to a 47.2 per cent reduction in emissions (Table 11).
Table 11. Annual Targets for the period 2010-2027
| Year |
Targets (in tCO 2e) |
Percentage reduction against 1990 baseline when targets were set - using the 1990-2008 inventory |
Percentage reduction against 1990 baseline - based on latest (1990-2015) inventory |
|---|---|---|---|
| 2010 |
53,652,000 |
-23.6% |
-30.4% |
| 2011 |
53,404,000 |
-23.9% |
-30.7% |
| 2012 |
53,226,000 |
-24.2% |
-31.0% |
| 2013 |
47,976,000 |
-31.7% |
-37.8% |
| 2014 |
46,958,000 |
-33.1% |
-39.1% |
| 2015 |
45,928,000 |
-34.6% |
-40.4% |
| 2016 |
44,933,000 |
-36.0% |
-41.7% |
| 2017 |
43,946,000 |
-37.4% |
-43.0% |
| 2018 |
42,966,000 |
-38.8% |
-44.3% |
| 2019 |
41,976,000 |
-40.2% |
-45.6% |
| 2020 (year of interim target) |
40,717,000 |
-42.0% |
-47.2% |
| 2021 |
39,495,000 |
-43.7% |
-48.8% |
| 2022 |
38,310,000 |
-45.4% |
-50.3% |
| 2023 |
37,161,000 |
-47.1% |
-51.8% |
| 2024 |
35,787,000 |
-49.0% |
-53.6% |
| 2025 |
34,117,000 |
-51.4% |
-55.7% |
| 2026 |
32,446,000 |
-53.8% |
-57.9% |
| 2027 |
30,777,000 |
-56.2% |
-60.1% |
Contact
There is a problem
Thanks for your feedback