Scottish Surveys Core Questions 2014
Official statistics publication on equality groups across a range of measures from harmonised questions across the major SG population surveys.
This document is part of a collection
2 Age and Sex
SSCQ data is calibrated to reflect annual population estimates from the National Records of Scotland. The distribution from the survey therefore mirrors the published figures from NRS. [32]
Age and sex are determining factors across most indicators in the SSCQ. In the following sections we examine the differences between age groups and sexes.
Where formal testing is conducted, the median age group (45-54) is used as the reference category for comparison between age groups and "Female" is used as the reference category between sexes. Where p-values are provided, a value of less than 0.05 indicates statistical significance at the 95% level. For more information about statistical tests, see section 11.11.
Summary Findings
- Good or very good general health generally decreases with age; there is no apparent difference between men and women
- Long-term limiting health conditions increase with age. Women tend to report slightly higher levels than men, likely due to a greater prevalence of older women.
- Smoking rates peak in the 25-34 age group at 27.6%, falling with age to 8.5% for those aged 75 or over. Men have higher smoking rates overall. There is a general reduction in smoking rates over time; this is most evident in the 35-44 and 55-64 age groups.
- The highest levels of mental wellbeing are reported by 25-34 and 65-74 year olds. Other age groups are close to the national average except for those aged 75+ who have lower levels in general.
- Women are more likely than men in general to provide unpaid care. Around one fifth of women provide care, compared with 15.7% of men. Unpaid care provision peaks between ages 55-64 when around a quarter of adults provide unpaid care.
- Women are less likely than men to think that crime in their area has reduced or stayed the same in the previous 2 years; around three quarters of women compared with nearly 80% of men.
2.1 General Health
Figure 4: General health by age group, SSCQ 2014
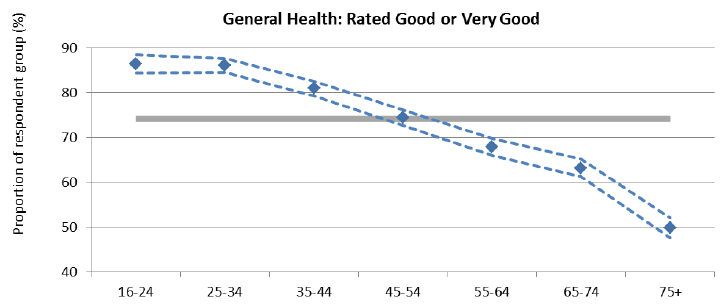
There is a clear correlation between age and "Good/Very good" self-assessed general health, illustrated in Figure 4.
While over 85% of under-35s report good health, this rate drops systematically for older ages to around half for those aged 75+. From age 35, each of the age groups has a significantly lower level of good or very good health than the previous group.
There is no apparent association between sex and self-assessed general heath. The apparent gap between females and males of 1.4 percentage points in 2013 is attributable to random effects in the sample.
Table 13: General health by age and sex, SSCQ 2014; changes from 2013 and 2012
| 2014 |
Change |
||||
|---|---|---|---|---|---|
| grp % |
+/- |
from 2013 |
from 2012 |
||
| Age |
16-24 |
86.3 |
± 2.0 |
-1.8 |
-1.5 |
| 25-34 |
86.0 |
± 1.5 |
+0.4 |
+0.8 |
|
| 35-44 |
80.9 |
± 1.6 |
-2.7 |
+0.5 |
|
| 45-54 |
74.4 |
± 1.7 |
-0.4 |
+0.7 |
|
| 55-64 |
67.9 |
± 1.8 |
-1.1 |
+0.9 |
|
| 65-74 |
63.2 |
± 2.0 |
+1.3 |
+3.3 |
|
| 75+ |
49.8 |
± 2.2 |
-1.5 |
+0.6 |
|
| Sex |
Male |
74.2 |
± 1.1 |
-1.7 |
-0.2 |
| Female |
74.1 |
± 1.0 |
-0.5 |
+0.9 |
|
2.2 Long-term Limiting Health Conditions
There is a clear relationship between age and long-term condition, illustrated in Figure 5.
Prevalence of long-term limiting health conditions rises from less than 10% in the 16-24 group to over half of over 75s.
Figure 5: Long-term limiting health conditions by age group, SSCQ 2014
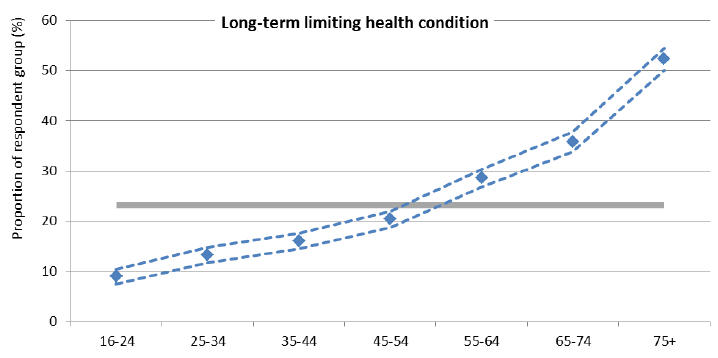
A slightly higher proportion of women (24.8%) report a long-term limiting health condition compared with men (21.5%). This statistically significant difference may be due to the greater proportion of older women in the population as a whole compared to men.
Table 14: Long-term limiting health conditions by age and sex, SSCQ 2014; changes from 2013 and 2012
| 2014 |
Change |
||||||
|---|---|---|---|---|---|---|---|
| grp % |
+/- |
from 2013 |
from 2012 |
||||
| Age |
16-24 |
8.9 |
± 1.5 |
-0.2 |
+0.4 |
||
| 25-34 |
13.3 |
± 1.5 |
+2.8 |
|
+1.4 |
||
| 35-44 |
16.0 |
± 1.5 |
+2.5 |
|
-0.1 |
||
| 45-54 |
20.4 |
± 1.6 |
+0.7 |
-1.9 |
|||
| 55-64 |
28.6 |
± 1.8 |
-1.2 |
-2.6 |
|
||
| 65-74 |
35.8 |
± 1.9 |
-1.6 |
-3.8 |
|
||
| 75+ |
52.3 |
± 2.2 |
+2.0 |
-1.8 |
|||
| Sex |
Male |
21.5 |
± 1.0 |
+0.8 |
-1.0 |
||
| Female |
24.8 |
± 0.9 |
+1.1 |
-0.6 |
|||
2.3 Smoking
Figure 6: Smoking prevalence by age group, SSCQ 2014
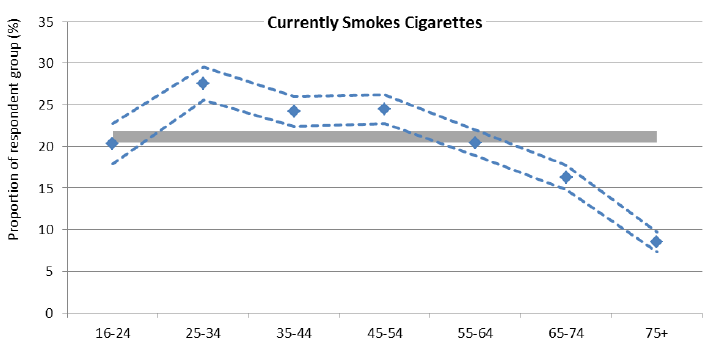
Smoking is not as prevalent among older age groups. Those aged 65 or over have lower smoking rates than the national average, while the 25-54 age groups have higher than average levels.
The highest point estimate is for the 25-34 group, at 27.6%, while those aged 75+ have the lowest rates at 8.5%. This is likely due to changes in habit with age and premature deaths among smokers.
Over three years there is a clear reduction in the smoking rates for those aged 35-44 (5 percentage point reduction since 2012) and those aged 55-64 (a 3.7 point reduction). Across all other age groups under 75 there have been marginal reductions, but these are not statistically significant.
Smoking rates among women are somewhat lower than for men: 22.7% of men smoked in 2014, compared with 19.8% of women.
Smoking rates fell by around the same percentage point amount for men and women since 2012.
Table 15: Smoking prevalence by age and sex, SSCQ 2014; changes from 2013 and 2012
| 2014 |
Change |
|
||||
|---|---|---|---|---|---|---|
| grp % |
+/- |
from 2013 |
from 2012 |
|||
| Age |
16-24 |
20.4 |
± 2.4 |
-3.4 |
-3.2 |
|
| 25-34 |
27.6 |
± 2.0 |
+1.6 |
-0.8 |
||
| 35-44 |
24.2 |
± 1.8 |
-1.9 |
-5.1 |
|
|
| 45-54 |
24.5 |
± 1.7 |
-1.7 |
-2.2 |
||
| 55-64 |
20.5 |
± 1.5 |
-1.7 |
-3.7 |
|
|
| 65-74 |
16.3 |
± 1.5 |
-0.4 |
-1.6 |
||
| 75+ |
8.5 |
± 1.2 |
+0.5 |
+0.9 |
||
| Sex |
Male |
22.7 |
± 1.1 |
-1.5 |
-2.7 |
|
| Female |
19.8 |
± 0.9 |
-0.8 |
-2.5 |
|
|
2.4 Mental Wellbeing
Figure 7: Average SWEMWBS score by age group, 2014
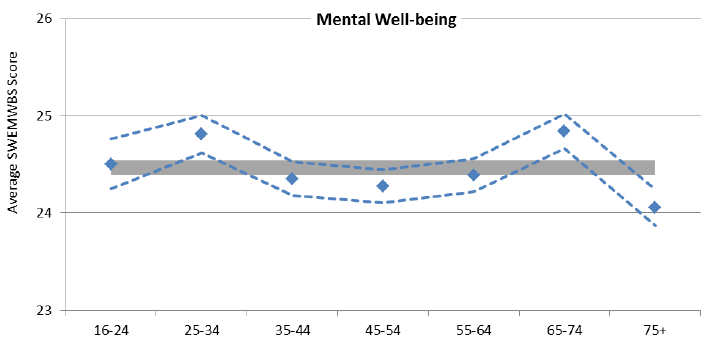
Average SWEMWBS score varies by age group. Higher scores are detected among the 25-34 and 65-74 age groups, with lower scores between ages 35-64. The lowest average score is found in the 75+ age group.
There is no significant difference in the average mental wellbeing of men and women. The apparent small diffference in point estimates is not discernable from the effects of random sampling (p=0.3).
Table 16: Average SWEMWBS score by age group, 2014
| 2014 |
|||
|---|---|---|---|
| Mean |
+/- |
||
| Age |
16-24 |
24.5 |
± 0.3 |
| 25-34 |
24.8 |
± 0.2 |
|
| 35-44 |
24.4 |
± 0.2 |
|
| 45-54 |
24.3 |
± 0.2 |
|
| 55-64 |
24.4 |
± 0.2 |
|
| 65-74 |
24.8 |
± 0.2 |
|
| 75+ |
24.1 |
± 0.2 |
|
| Sex |
Male |
24.5 |
± 0.1 |
| Female |
24.4 |
± 0.1 |
|
2.5 Provision of Unpaid Care
The proportion of all adults providing unpaid care is highest between the ages of 45 and 64. Around a quarter of this group provides unpaid care. The lowest level is in the 16-24 year old age groupat 8.2%, and this rises steadily to the 25% peak in 45-54 year-olds. From age 65 onwards the proportion providing unpaid care drops off; 11.7% of those aged 75 or over provide unpaid care.
There are clear differences between sexes in the provision of unpaid care: overall nearly a fifth of women provide care, but fewer men (15.7%).
Table 17: Provision of unpaid care by sex and age group, SSCQ 2014
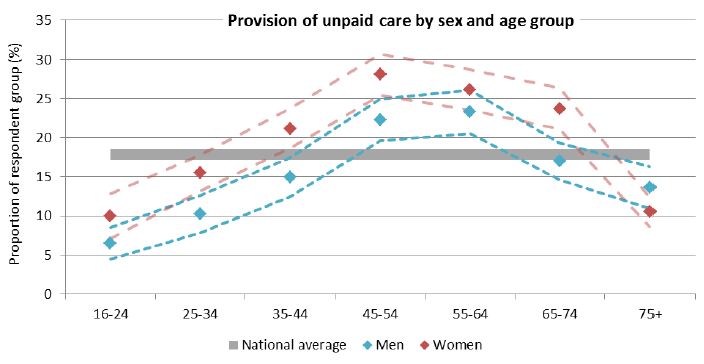
The difference between sexes is stable across most age groups, but less clear in the 16-24 and 55-64 year-olds. Formal testing confirms that women have a higher rate of providing care than men in the 16-24 age group (10.0% compared with 6.5%, p=0.046). Among 55-64 year olds, the difference between sexes is not statistically significant (p=0.14).
The point estimate for men aged 75+ is higher than that for women, but this difference is not statistically significant (p=0.058).
Table 18: Provision of unpaid care by sex and age group, SSCQ 2014
| Men |
Women |
All adults |
||||
|---|---|---|---|---|---|---|
| 16-24 |
6.5 |
± 2.0 |
10.0 |
± 2.9 |
8.2 |
± 1.8 |
| 25-34 |
10.3 |
± 2.4 |
15.5 |
± 2.3 |
12.9 |
± 1.7 |
| 35-44 |
14.9 |
± 2.5 |
21.2 |
± 2.6 |
18.1 |
± 1.8 |
| 45-54 |
22.2 |
± 2.7 |
28.1 |
± 2.6 |
25.2 |
± 1.9 |
| 55-64 |
23.3 |
± 2.8 |
26.1 |
± 2.6 |
24.7 |
± 1.9 |
| 65-74 |
17.0 |
± 2.4 |
23.7 |
± 2.6 |
20.5 |
± 1.8 |
| 75+ |
13.6 |
± 2.7 |
10.5 |
± 1.9 |
11.7 |
± 1.6 |
| All ages |
15.7 |
± 1.0 |
19.9 |
± 1.0 |
17.9 |
± 0.7 |
2.6 Perceptions of Local Crime Rate
There is no apparent general trend with age in perception of changes in the local crime rate. More people aged 75 or over think that crime has reduced or stayed the same in the past two years, at around 80%. The lowest levels for this indicator are found among 35-44 year olds at 75.5%. While these two groups are significantly different from each other, only those aged 75+ are significantly different from the national average.
Men are more likely than women to think that crime has reduced or stayed the same; 79.5% for men compared with 75.4% for women.
Table 19: Local crime rate by age and sex, SSCQ 2014; changes from 2013 and 2012
| 2014 |
Change |
|||||
|---|---|---|---|---|---|---|
| grp % |
+/- |
from 2013 |
from 2012 |
|||
| Age |
16-24 |
77.0 |
± 3.3 |
-3.0 |
+0.3 |
|
| 25-34 |
76.2 |
± 2.4 |
-1.3 |
+0.5 |
||
| 35-44 |
75.5 |
± 2.2 |
+0.4 |
+0.7 |
||
| 45-54 |
76.4 |
± 2.0 |
-0.1 |
+1.8 |
||
| 55-64 |
78.4 |
± 1.9 |
+0.3 |
+2.0 |
||
| 65-74 |
78.8 |
± 1.9 |
+0.1 |
+1.8 |
||
| 75+ |
80.2 |
± 1.9 |
+1.5 |
+4.0 |
|
|
| Sex |
Male |
79.5 |
± 1.2 |
-0.0 |
+1.7 |
|
| Female |
75.4 |
± 1.2 |
-0.4 |
+1.5 |
||
2.7 Confidence in Police
Analysis of Confidence in Police is conducted on latent classes across all six questions. These statistics are in development and are therefore provided in a supplementary paper available from the SSCQ website. [33]
Contact
There is a problem
Thanks for your feedback

