Self-directed Support, Scotland, 2014-15
This ‘Data under Development’ Statistics Release presents the latest client and expenditure figures for Self-directed Support (SDS) in its first year of implementation (2014-15). SDS was introduced in Scotland on 1st April 2014 following the Social Care (
This document is part of a collection
4. Expenditure
4.1 Expenditure Recording
The 2015 Social Care Survey asked local authorities to return information on the gross [8] value of the agreed budget associated with each care package associated with an SDS option. For the analysis in this section, the budgeted expenditure associated with Option 4 is included under the specific options - Option 1, 2 and / or 3 - of the mixture chosen for each client.
Section 2.2 described the issues surrounding recording systems and the ability of local authorities to capture SDS information during 2014-15. There, 10 local authorities are identified who suffered from incomplete SDS options recording. In addition, variation in the recording of budgeted expenditure is also evident from the data. All local authorities who returned client information on those receiving Option 1 were able to record some budgeted expenditure under Option 1. However:
- Of the 22 local authorities who were able to return client information on those receiving Option 2, three local authorities were not able to provide any budgeted expenditure information.
- Of the 23 local authorities who were able to return client information on those receiving Option 3, 10 local authorities were not able to provide any budgeted expenditure information.
- In addition to problems at the aggregate level, all local authorities had numerous instances of individual clients with no budgeted expenditure against a recorded SDS option.
In total, only 13 local authorities were able to provide client information on all SDS options and include some budgeted expenditure against those options. In light of the analyses carried out in the following sub-sections, however, all local authorities with recorded budgeted expenditure are included.
4.2 Expenditure Breakdown
In total, the combined values of all recorded budgets associated with an SDS option in 2014-15 was £250m. Given the expenditure recording issues highlighted above - in addition to the recording issues described in Section 2.2 - this figure represents an underestimate of the true value. The observed figure represents 15% of gross expenditure by local authorities on community based Social Work services in 2014-15 [9] .
Table 1 shows the breakdown of total budgeted expenditure for Option 1, Option 2 and Option 3. Given the expenditure recording issues highlighted in Section 4.1, the total budget values for the three options should not be compared to one another. The average (median) budget value per client may, however, be compared in this way. Table 1 shows that Option 2 is associated with the highest average budget values, followed by Option 1. Option 3 is associated with much lower average values. This pattern is not surprising, since clients choosing Option 1 and Option 2 are on average younger than clients choosing Option 3. Younger clients are expected to have higher / more complex levels of need than older clients, and as a result average expenditure will be higher.
Table 1: breakdown of budgeted expenditure by SDS option, 2014-15
| Total budget values | Median budget per client | |
|---|---|---|
| Option 1 (data for 31 local authorities [10] ) |
£80m | £7,200 |
| Option 2 (data for 19 local authorities [11] ) |
£78m | £10,300 |
| Option 3 (data for 13 local authorities [12] ) |
£81m | £1,800 |
| All SDS | £250m | £6,100 |
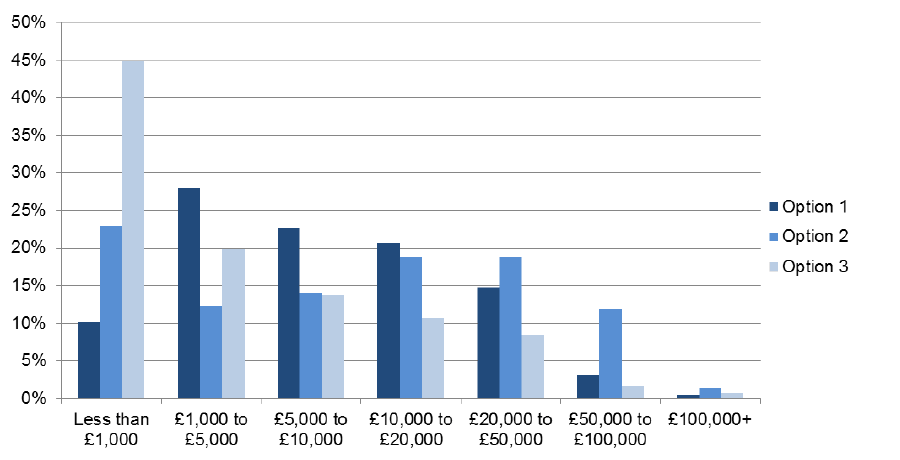
Figure 9 shows the distribution of budgeted expenditure per client for Option 1, Option 2 and Option 3. For Option 3, the highest proportion of budgets (45%) are in the less than £1,000 category - the proportion of clients in each budget category then steadily falls as budget values rise. For Option 1, in contrast, the highest proportion of budgets (28%) are in the £1,000 to £5,000 category. For budget categories above these values, the proportion of clients in each budget category then steadily falls. The pattern for Option 2 is less clear. The highest proportion of budgets (23%) are in the less than £1,000 category - the proportion of budgets in each category then fluctuates between 12% and 19% for budget values up to £100,000.
Figure 9: histograms of client gross budgets by SDS option, 2014-15

Information is based on a varying number of local authorities for each SDS option.
Contact
There is a problem
Thanks for your feedback