Social Care Services, Scotland, 2017
Latest national figures for social care services provided or purchased by Local Authorities in Scotland.
This document is part of a collection
3. Older People – Clients aged 65+
This section provides more detail on those people receiving Social Care services who are aged 65 and over, and who account for three-quarters (75%) of all Social Care clients reported on in this publication.
3.1 Home Care for clients aged 65+
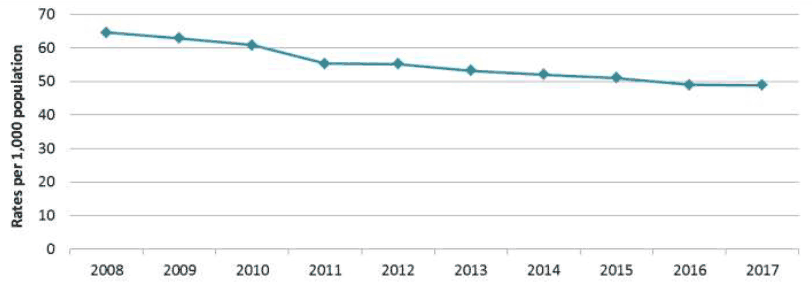
There were 48,800 Home Care clients aged 65+ in March 2017. The rate per population of clients aged 65+ receiving Home Care has decreased over time to 48.9 per 1,000 population in 2017 (Figure 16). The decrease in rates per population may be partly due to an increase in the elderly population and care being focused on clients with highest levels of need.
Figure 16: Home Care clients per 1,000 population aged 65+, 2007 to 2017 1
1. 2017 Scotland figures are provisional as Angus council figures relate to 2016.
Source: Scottish Government Social Care Survey 2013-2017, Home Care Census 2006-2012
Population data: National Records for Scotland mid-year population estimates up to 2017 (latest available).
The number of people aged 65+ receiving Home Care has decreased slightly in 2017, following a larger decrease in the previous year (Figure 17). However, the number of Home Care hours provided has increased by 2% in 2017, following a decrease in the previous year.
Figure 17: Home Care clients aged 65+ and hours provided, 2010 to 2017 1
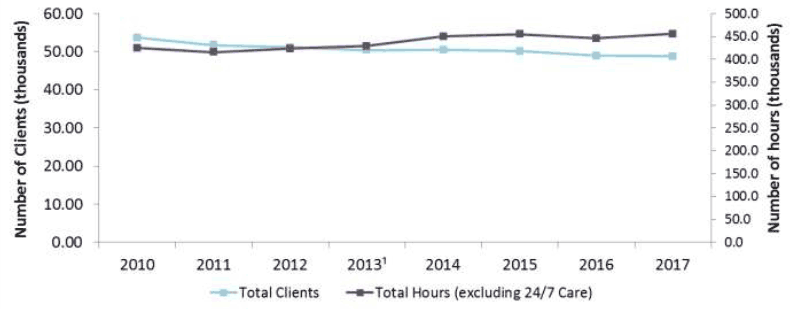 From 2013, Local Authorities were asked to class 24-7 care as Housing Support, not Home Care.
1. 2017 Scotland figures are provisional as Angus council figures relate to 2016.
Source: Scottish Government Social Care Survey 2013-2017, Home Care Census 2010-2012
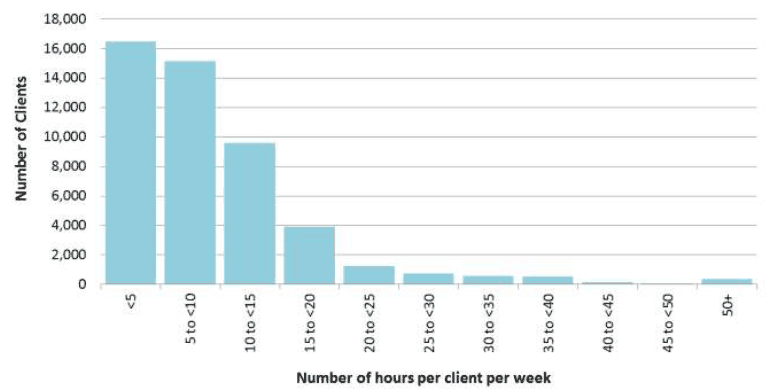
The majority of Home Care clients tend to receive smaller amounts of care per week; nearly two thirds (65%) of those aged 65+ received less than 10 hours of care per week (Figure 18), while 8% received more than 20 hours of care per week in March 2017.
Figure 18: Home Care clients aged 65+ by level of service, 2017 1
1. 2017 Scotland figures are provisional as Angus council figures relate to 2016.
Source: Scottish Government Social Care Survey 2017
Table 2 shows that 52% of Home Care clients aged 65+ in March 2017 received their care solely from Local Authorities, down from 53% in 2016. The table also provides two measures of the average hours of care provided per week to clients aged 65+, by service provider; the mean (total hours divided by the number of clients) and the median (the "middle" value; half of the values are greater than it and half less, which reduces the impact of extremely large values). Both measures show that those clients receiving care solely from Local Authorities tend to have smaller amounts of care per week.
Table 2: Home Care for clients aged 65+, by service provider, 2017 1
| Service Provider | Number of clients | Client hours | Average (mean) hours per week | Average (median) hours per week | ||
|---|---|---|---|---|---|---|
| Local Authority only | 25,450 | 52% | 187,800 | 41% | 7 | 6 |
| Private sector only | 18,510 | 38% | 192,100 | 42% | 10 | 8 |
| Voluntary sector only | 1,480 | 3% | 25,900 | 6% | 18 | 7 |
| LA plus private | 2,670 | 5% | 39,400 | 9% | 15 | 12 |
| LA plus voluntary | 510 | 1% | 7,200 | 2% | 14 | 11 |
| All other combinations | 180 | 0% | 3,000 | 1% | 17 | 14 |
| Total | 48,800 | 100% | 455,500 | 100% | 9 | 7 |
1. 2017 Scotland figures are provisional as Angus council figures relate to 2016.
Source: Scottish Government Social Care Survey 2017
Figure 19 shows the distribution of March 2017 Home Care clients aged 65+, by the principal reason they are receiving care (their 'client group'). There are a large number who receive care either as a result of frailty due to old age, or due to a physical disability. Note that Dementia is known to be under-recorded by Local Authorities, and so it is likely there are clients in other client groups ( e.g. "Frail Older people") who have Dementia.
Figure 19: Home Care Clients aged 65+ by Client group and age group, 2017
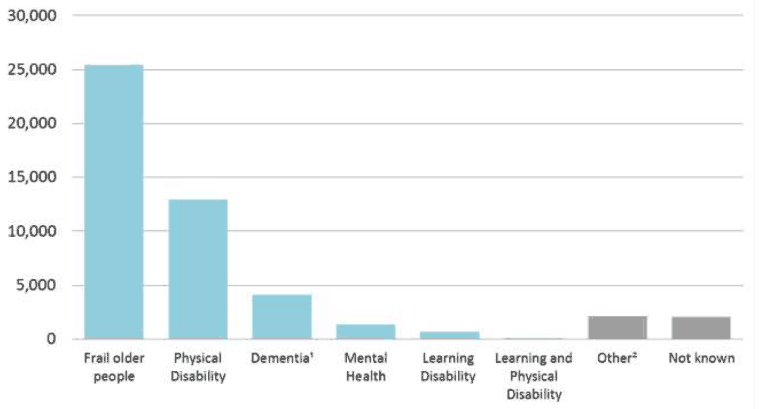
Based on 48,800 home care clients aged 65+.
¹ Dementia is known to be under recorded in the social care management information system.
² Other includes addictions, palliative care and carers.
³ 2017 Scotland figures are provisional as Angus council figures relate to 2016.
Source: Scottish Government Social Care Survey 2017
Figure 20 shows that of the Home Care clients aged 65+, for whom living arrangements are known, 55% lived alone. As would be expected, this is higher than the figure for 18-64 year olds (40%).
Figure 20: Living arrangement of clients aged 65+ receiving Home Care services, 2017
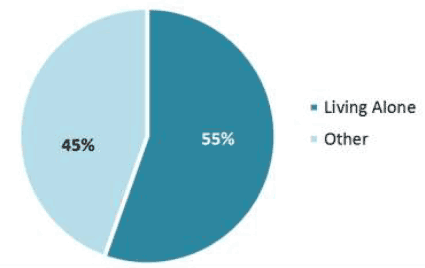
Based on 30,980 clients for whom Living Arrangements were known. Information was unavailable for 17,820 clients. 2017 Scotland figures are provisional as Angus council figures relate to 2016.
Source: Scottish Government Social Care Survey 2017
3.2 Community Alarm / Telecare Services for clients aged 65+
From 2015, Local Authorities were asked to provide data on Community Alarm/Telecare services provided at any time during the financial year – previously only those receiving the service during the March census week were recorded. This has contributed to a jump in the number of Community Alarm/Telecare clients recorded in the last two years.
In the year 2016-17, 111,270 people aged 65+ made use of a Community Alarm and/or another Telecare Service, with 70% of these people having only a Community Alarm (Figure 21).
Figure 21: Distribution of clients aged 65+ receiving Community Alarm and/or another Telecare service, by client group, 2017
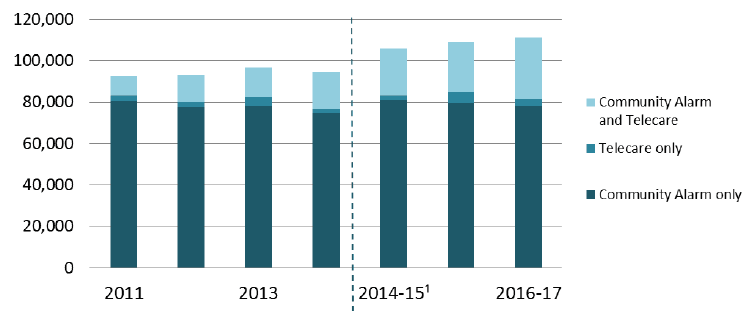
1. From 2015 Local Authorities were asked to record all clients receiving Community Alarms/Telecare at any time during the financial year. Previously only clients receiving these services during the March census week were recorded.
2. 2017 Scotland figures are provisional as Angus council figures relate to 2016.
Source: Scottish Government Social Care Survey 2013-2017, Home Care Census 2011-2012
3.3 Direct Payments for clients aged 65+
In 2016-17, 3,240 people aged 65+ received Direct Payments. The total amount spent by Local Authorities on Direct Payments for this age group in 2016-17 was an estimated £33.3 million. This saw the continuation of the trend of increasing numbers of people receiving Direct Payments; the number of clients aged over 65 receiving Direct Payments has increased by 13% since 2015-16. Figure 22 shows the increase in Direct Payment clients aged 65+ over the last ten years.
Figure 22: Number of people aged 65+ receiving Direct Payments¹, 2007-08 to 2016-17²
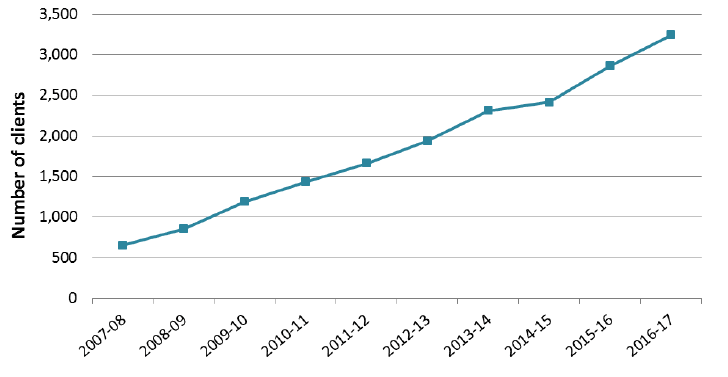
¹ Direct Payments total includes an estimate for East Renfrewshire council in 2014-15 – see 5.5 (background notes).
² 2017 Scotland figures are provisional as Angus council figures relate to 2016.
Source: Scottish Government Social Care Survey from 2013, Self-Directed Support/Direct Payments Survey up to 2012.
Table 3 shows the breakdown of 2016-17 clients aged 65+ receiving Direct Payments by client group. Frailty due to old age is the primary reason for clients in this age group receiving Direct Payments, followed by Physical Disabilities and Dementia.
Table 3: Direct Payments for clients aged 65+, by client group, 2016-17
| Client Group | Number of clients** | Expenditure (£ millions) | Mean 1 value of direct payments | Median 2 value of direct payments |
|---|---|---|---|---|
| Frail older people | 1,750 | £16.0 | £9,000 | £7,000 |
| Physical disability | 730 | £8.7 | £12,000 | £8,000 |
| Dementia*** | 390 | £4.3 | £11,000 | £8,000 |
| Mental Health | 70 | £0.7 | £9,000 | £7,000 |
| Learning disability**** | 40 | £0.8 | £23,000 | £10,000 |
| Other | 120 | £1.2 | £10,000 | £7,000 |
| Not known | 160 | £1.1 | £7,000 | £4,000 |
| All* | 3,240 | £33.3 | £10,000 | £7,000 |
* The expenditure figure presented for "All" clients aged 65+ receiving Direct Payments has been adjusted to account for missing 2017 data from Angus council, so are slightly higher than the sum of individual client groups. The client figures for are provisional, as figures for Angus council relate to 2016.
** Some clients receive more than one direct payment
*** Dementia is known to be under recorded in the social care management information system
**** Learning Disability includes clients with both a Learning Disability and Physical Disability.
1 The Mean denotes the "average" value of direct payments, i.e. the sum of all payments divided by the number of payments (rounded to nearest £1,000)
2 The Median denotes the "middle" value of direct payments, i.e. the value at which half of the payments are less and half are more (rounded to nearest £1,000)
Source: Scottish Government Social Care Survey 2017
Contact
There is a problem
Thanks for your feedback