Total income from farming: estimates for Scotland 2015-2017
The official measure of the net income gained by the agriculture industry in Scotland.
This document is part of a collection
9. NUTS2 regional estimates
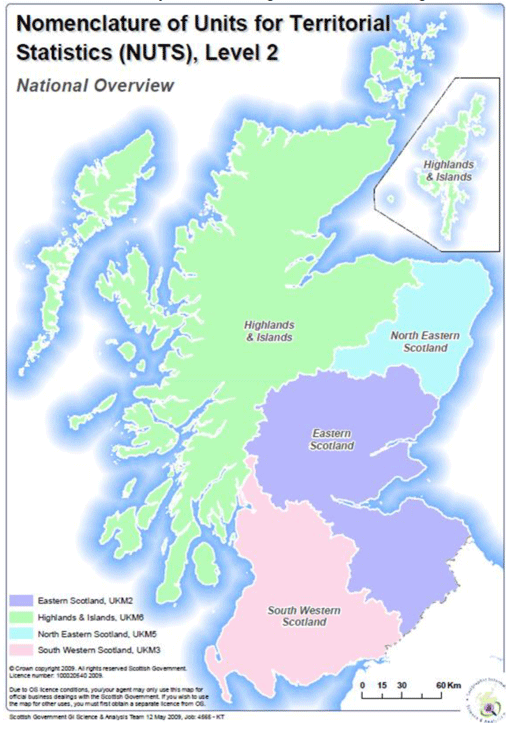
Regional estimates of TIFF have been calculated by allocating outputs and inputs to Scotland's four NUTS2-level regions [4] . Census and Farm Business Survey data are used to allocate livestock, crop data and costs, though it should be noted that uniform prices are applied across all regions. For example, the national estimate of dairy output is allocated in proportion to the number of dairy cows in each region, without taking into account any differential prices that there may be.
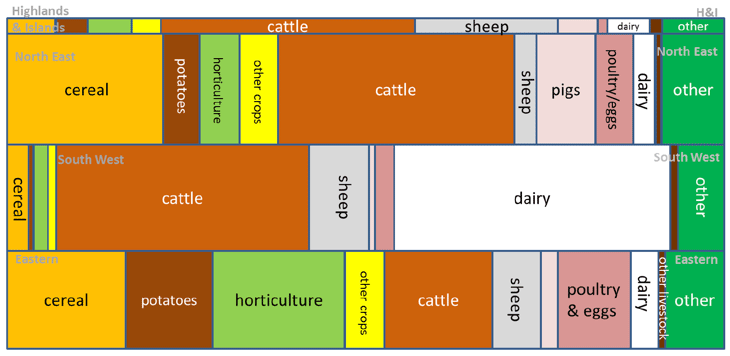
Chart 11 illustrates the relative importance of each output sector to the regions. The graphic relates to outputs only, estimated costs are not included and so the graphic should not be taken as illustrating regional sector GVA or profits. It can be seen that the South West relies heavily on output from milk, accounting for well over a third of the region's output, though also on beef production. Beef and cereals dominate the North East, with Highlands and Islands having important beef and sheep sectors, as well as relying more on other income sources. Eastern Scotland has the most balanced distribution of output, with cereals, potatoes, horticulture, cattle, and poultry each producing more than ten per cent of the region's output, with none above 20 per cent.
Chart 11: Estimated output per hectare by NUTS2 region 2017

Assumed uniformity of price is also an issue in the estimation of regional input costs. However, where these are taken from the Farm Business Survey, farm-type level costs are used, with each region's costs produced by applying the proportion of each farm-type in the region. Hence, for example, the Highlands and Islands region would be heavily influenced by the average costs of LFA cattle and sheep farms, whereas East Scotland would be more influenced by the average costs of cereal, horticulture or general cropping farms. This year we have also estimated differential costs for feed and fertiliser, based on research findings into the additional costs in rural areas, and for labour, based on the Hours and Earnings Survey.
It is also recognised that certain regions produce store cattle for other regions, and that this is not included directly in the regional TIFF calculations, as only exported cattle are counted. However, since income from slaughter is distributed in proportion to regional cattle numbers, and these numbers include those that will be sold as store, it is likely that the overall estimation for income from cattle will not be affected too much.
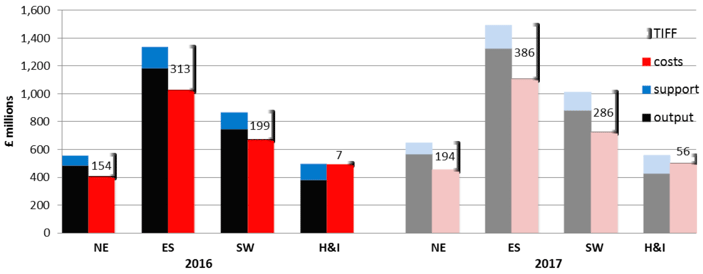
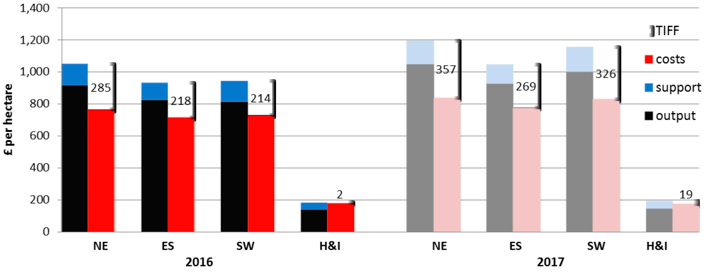
As illustrated in chart 13, the TIFF estimates for 2016, and initial estimates for 2017, suggest that on a per hectare basis, the highest level of income from farming is in the North East. In 2016 Eastern Scotland and the South West had similar values per hectare, though in 2017 the increased milk price benefited the South West. Highlands & Islands has the lowest income from farming, with agriculture estimated to have made only a very small profit once support is included.
Chart 12: Regional TIFF estimates for 2016 and initial estimates for 2017

Chart 13: Regional TIFF estimates, per hectare, for 2016 and initial estimates for 2017

Chart 14: Map showing NUTS2 Regions of Scotland used in regional analysis

Contact
There is a problem
Thanks for your feedback