Heat in buildings - multiple ownership mixed use buildings: energy retrofit possibilities
Scotland has many buildings which have multiple owners and mixed uses. This report categorises those buildings further and identifies potential solutions to decarbonise their heat supply and improve energy efficiency, in line with the heat in buildings strategy.
5. Phase 1 – Property identification
During Phase 1 of this project, properties which were classified with MOMU status were identified using Energy Saving Trust’s Home Analytics data. This allowed the segregation of properties into various categories. Phase 1 also included some preliminary costings, however, since these have now been superseded by newer values in Phase 2 (see Section 6), only the property identification will be covered in this section.
5.1. Logic definition
The objective of Phase 1 of the project was to develop profiles of each MOMU archetype to inform research into retrofit and decarbonisation pathways. During the profiling, each property was classified into one of the five MOMU archetypes and their key characteristics were compared based on a number of different dwellings in the Home Analytics database.
5.1.1. Data sources
- Home Analytics Scotland v3.7.1 which holds known and modelled property data for all residential dwellings in Scotland.
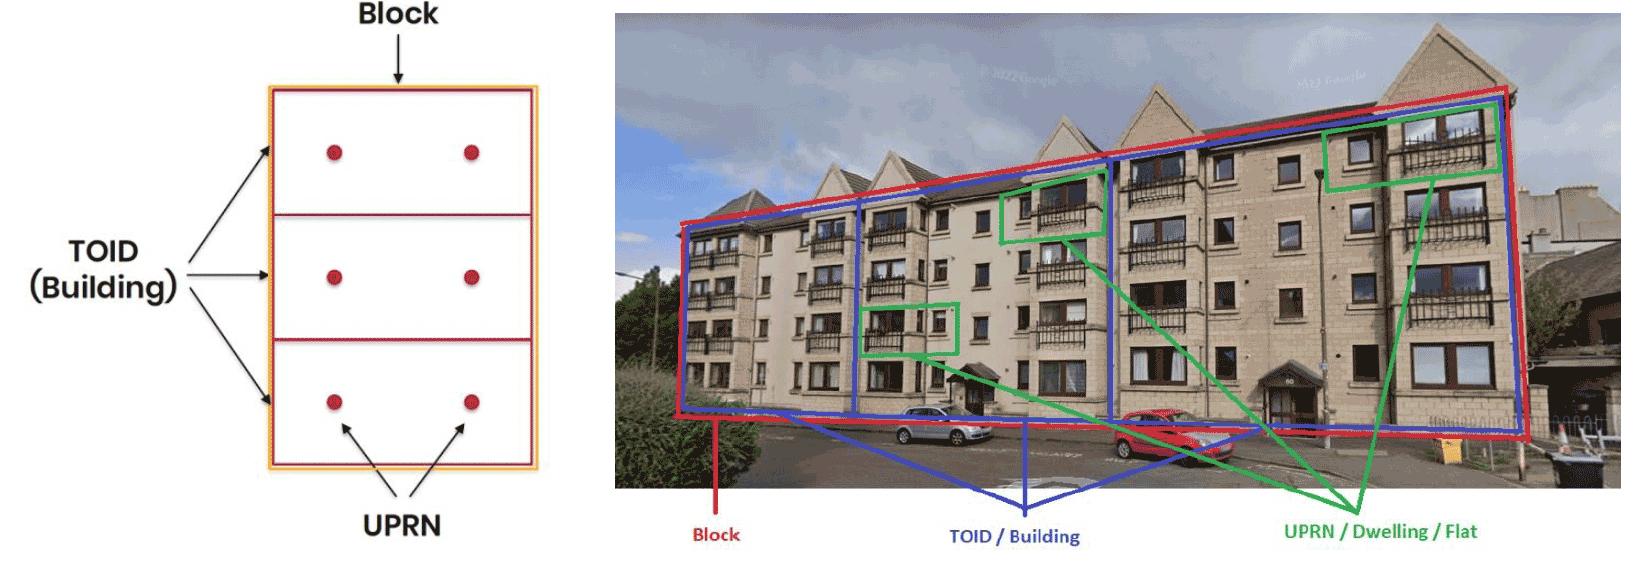
- Ordnance Survey AddressBase & MasterMap, used to define relationships between Unique Property Reference Numbers (UPRN), Topographic Identifiers (TOIDs) and building blocks.
5.1.2. Defining MOMU archetypes
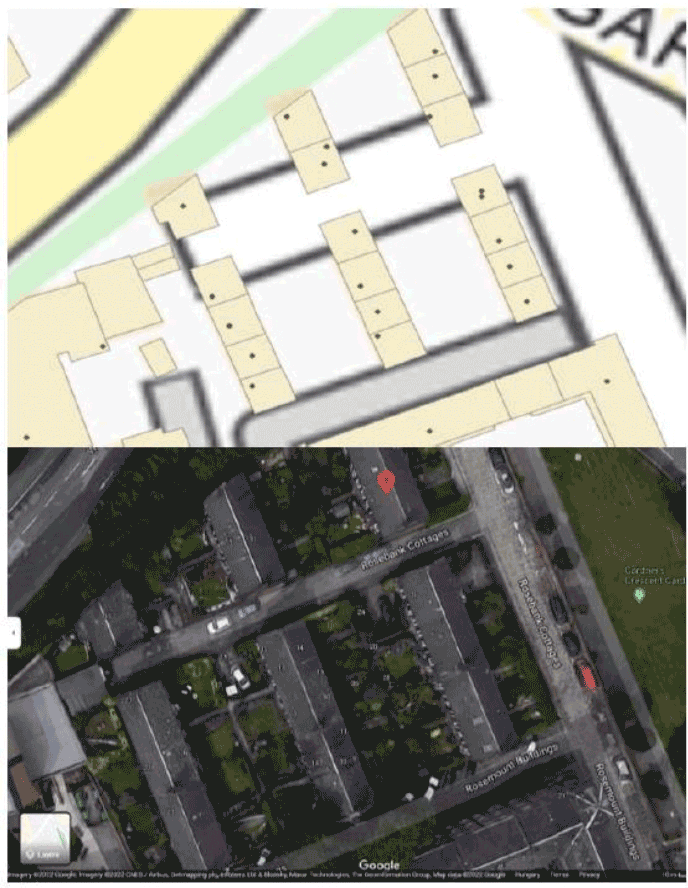
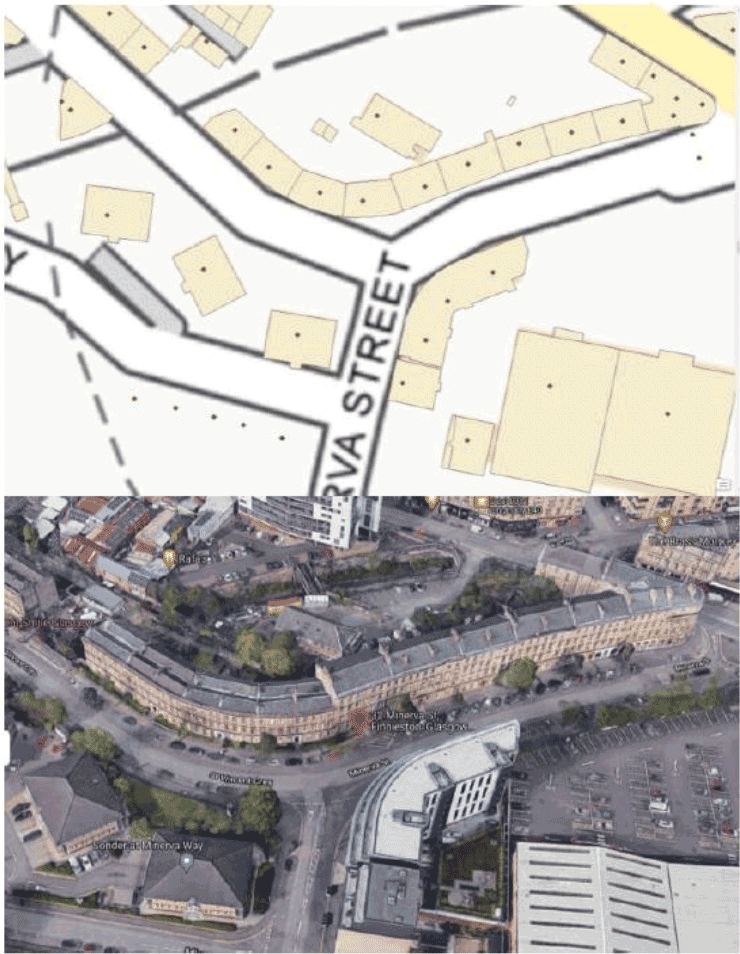
The physical structure of a building is shown in Figure 1. Each TOID is a building footprint with several individual flats, each with their own UPRN. A series of TOIDs in a row is called block.
5.1.3. The MOMU archetypes
Four-in-a-block:
In this archetype there are 4 UPRNs in one building block and:
- 4 UPRNs per TOID and 1 TOID in block; or
- 2 UPRNs per TOID and 2 TOIDs in block
Low rise blocks
For these properties, the height should be <21 meters and:
- >2 UPRNs per TOID and <3 TOIDs in block; or
- >19 UPRNs per TOID[1] and >2 TOIDs in block
High rise blocks
For these properties, the height should be >=21 meters and:
- >=21 UPRNs in TOID; or
- 1 TOID in block
Terraced flats
- There is always 2 UPRNs per TOID; and
- The number of UPRNs per block is two times the number of TOIDS in a block.[2] (for example if there are 3 TOIDs, we would have 6 UPRNs, if there are 4 TOIDs, we would have 8 UPRNs)
Tenements
In these properties there should be:
- >2 and <20 UPRNs[3] per TOID and >2 TOIDs in block; or
- 4 UPRNs per TOID and 2 TOIDs in block
5.2. Property summary statistics
5.2.1. Total property numbers
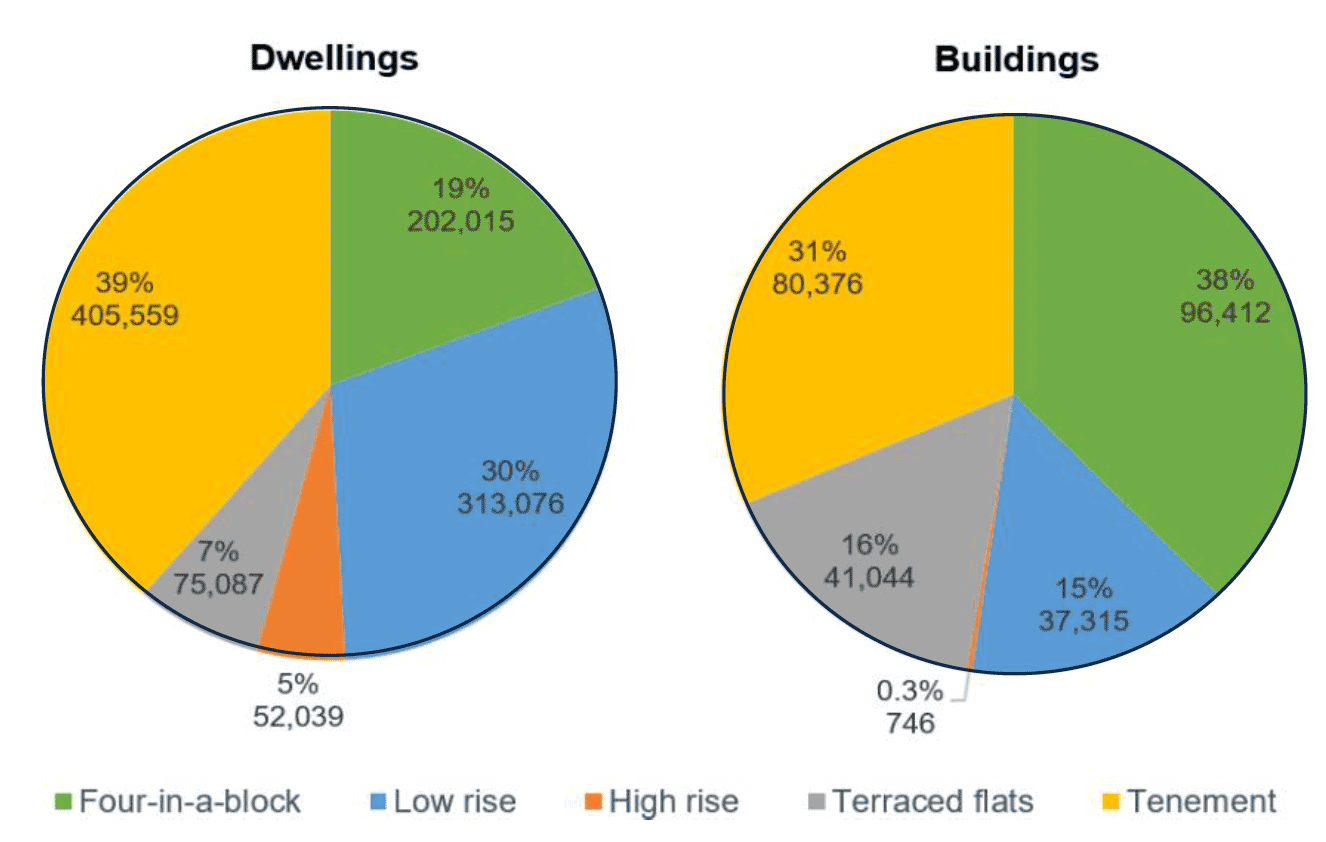
As shown in Figure 2, tenements account for the largest share of MOMU dwellings (39%). Four-in-a-block flats account for the largest share of MOMU buildings (38%), and low/high rise blocks account for 35% of MOMU dwellings but only 15% of buildings.
UPRNs) and buildings (i.e., TOIDs)
5.2.2. Urban / rural distribution
As shown in Figure 3, MOMU properties are predominantly located in urban areas.
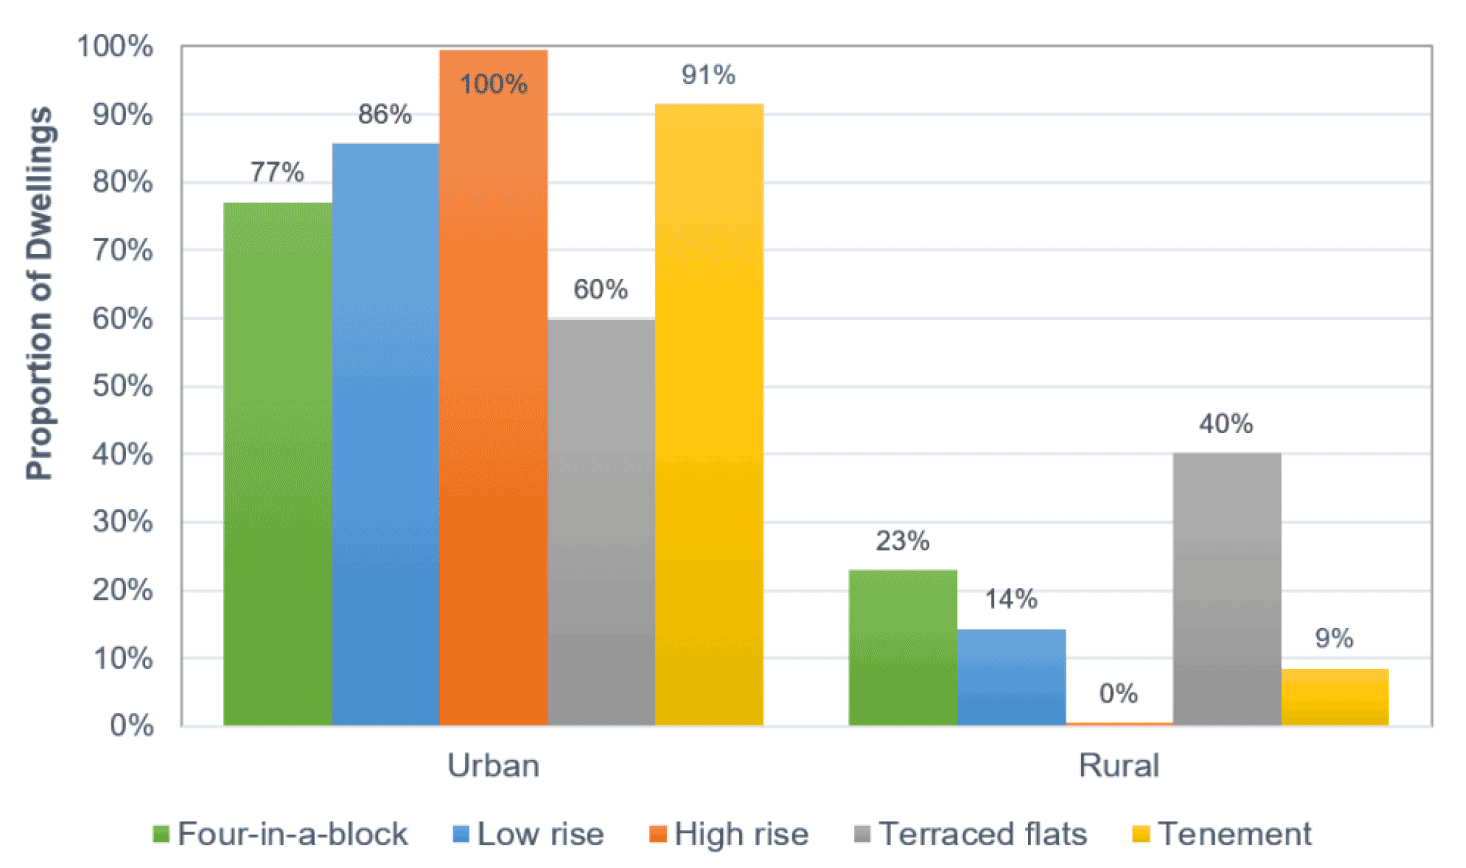
40% of terraced flats are located in rural areas and nearly a quarter of four-in-a-block flats are located in rural areas. High rises are found solely in urban areas. This high density of urban properties does limit what is possible in many cases, with space at a premium in these environments. This may limit what measures are possible in such areas.
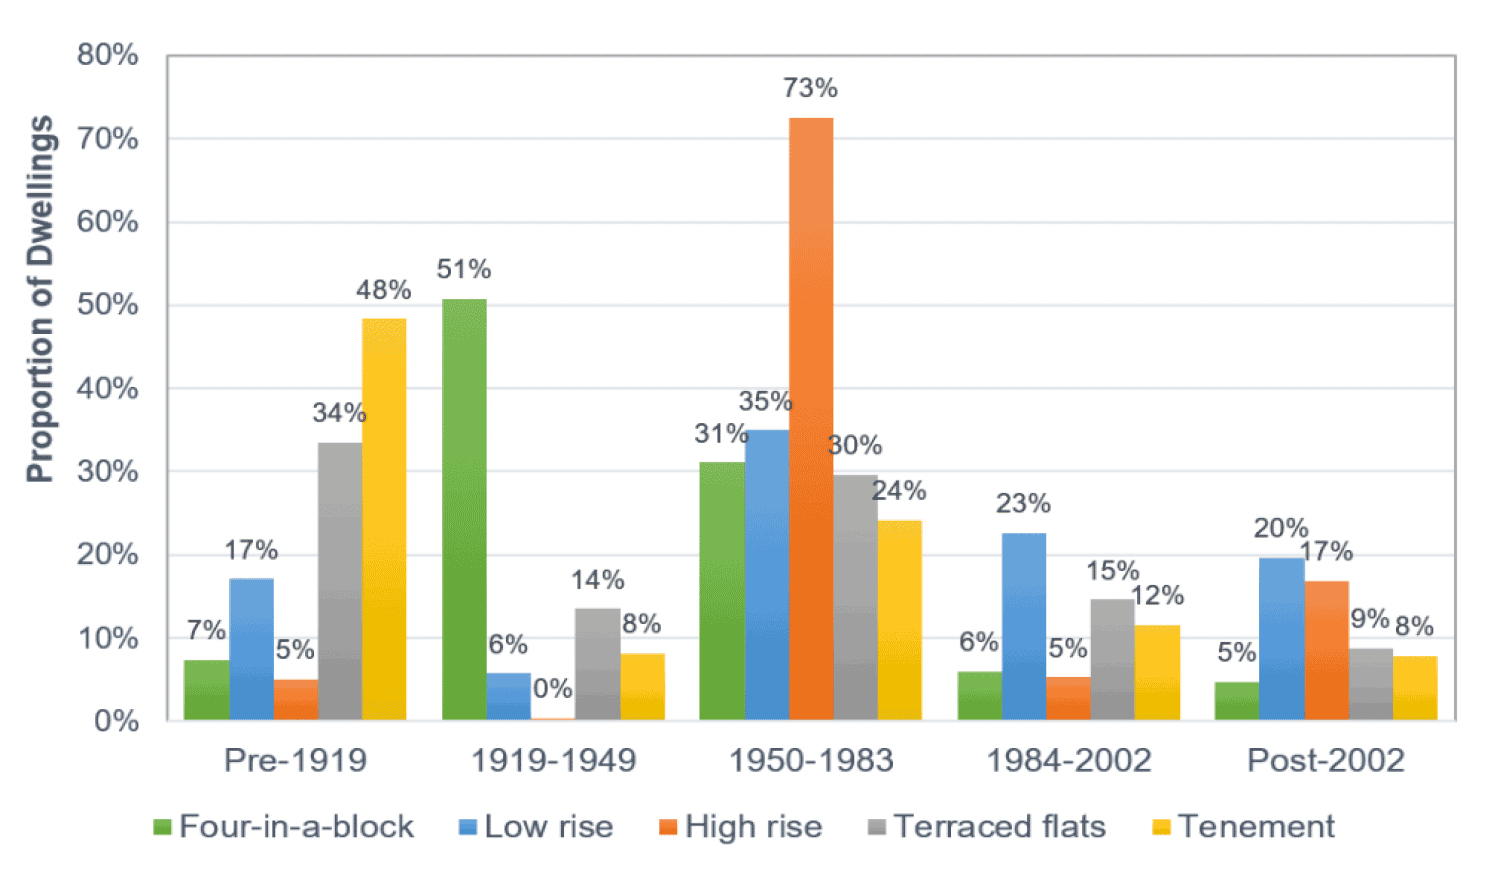
5.2.3. Property age
Figure 4 shows the distribution of the MOMU properties by property age. 48% of tenements were built before 1919 and 51% of four-in-a-blocks were built between 1919 and 1949. Three quarters of high rises were built between 1950 and 1983 and low-rise blocks have newer stock (43% built post-1984). Each age band presented with its own unique difficulties due to building regulations at the time. Where possible, measures were grouped across age bands for simplicity of presentation of these results.
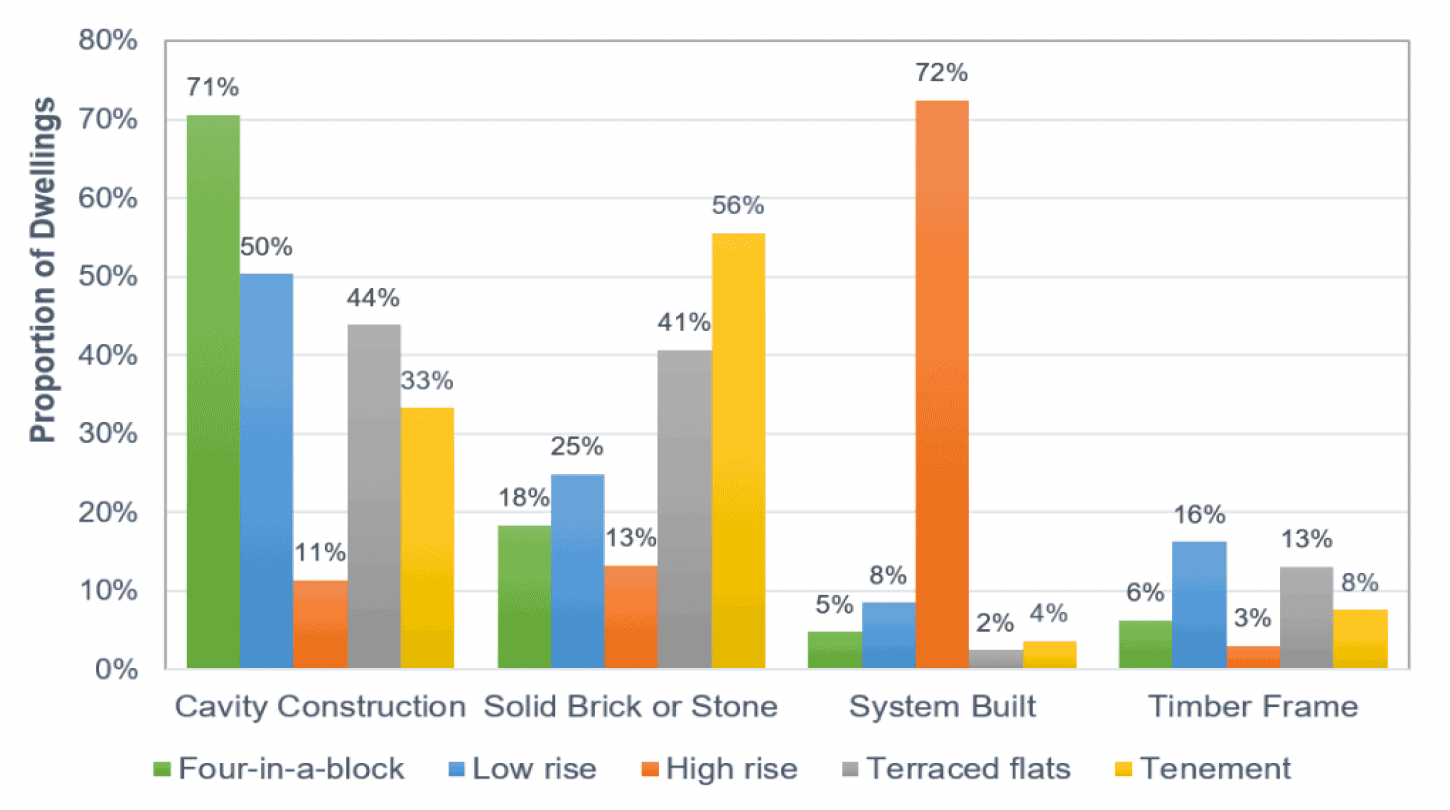
5.2.4. Wall construction type
Figure 5 shows the distribution of the wall types across the MOMU dataset. Four-in-a-block (71%) and low rise (50%) flats have the highest level of cavity walls. Tenements have the highest proportion of solid walls (56%). Terraced flats are split evenly between cavity / solid, and the majority of high rises are system built (72%).
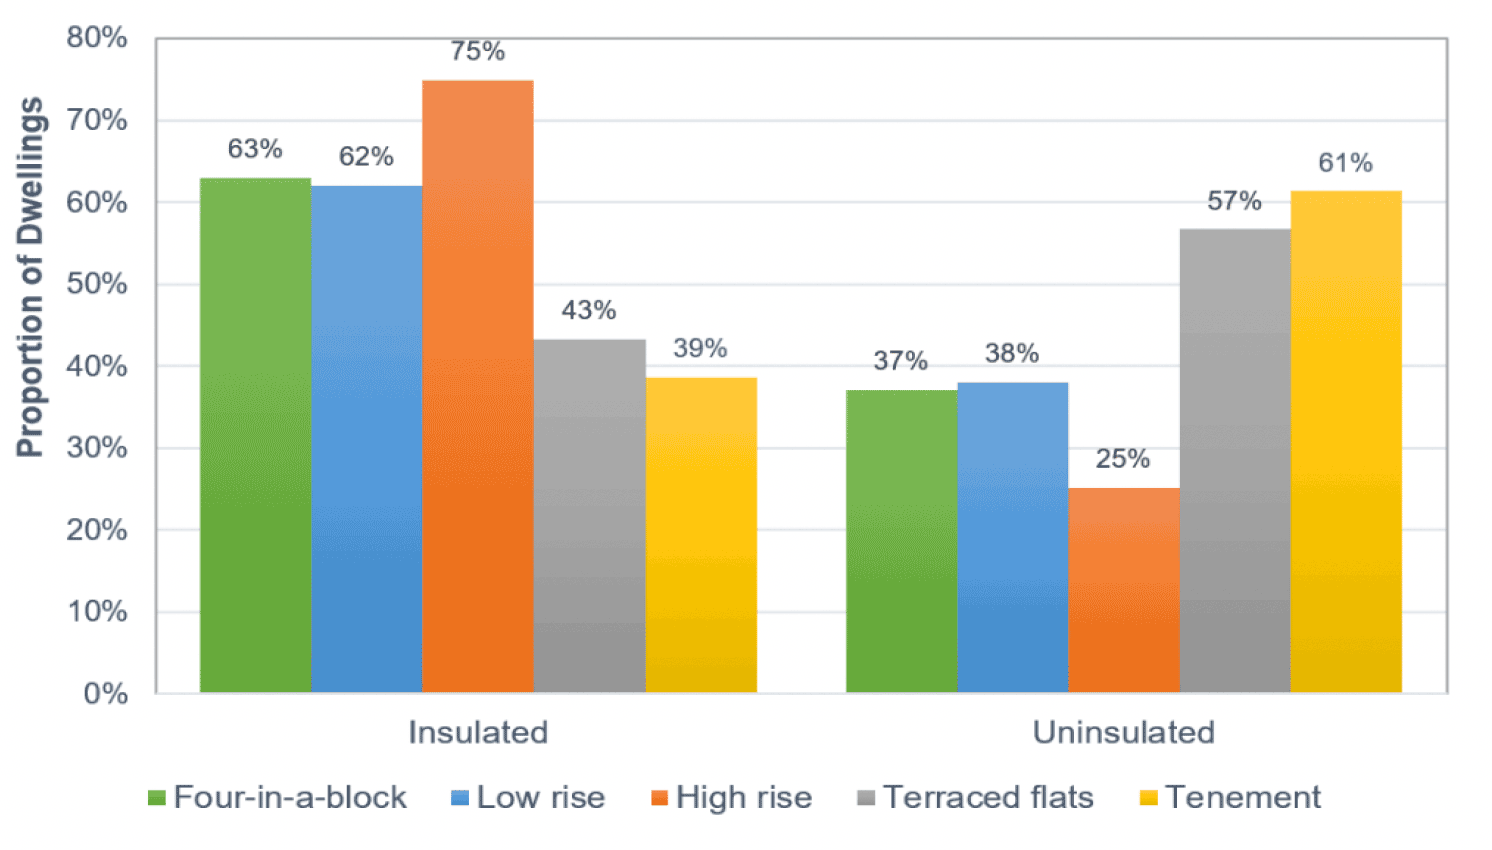
5.2.5. Wall insulation
Figure 6 shows the levels of wall insulation in the MOMU properties. MOMU wall insulation levels follow wall type distributions: terraced flats / tenements have the highest rate of solid walls and lowest insulation level (<43%), high rises are newer, with system-built walls and the highest insulation rate (75%).
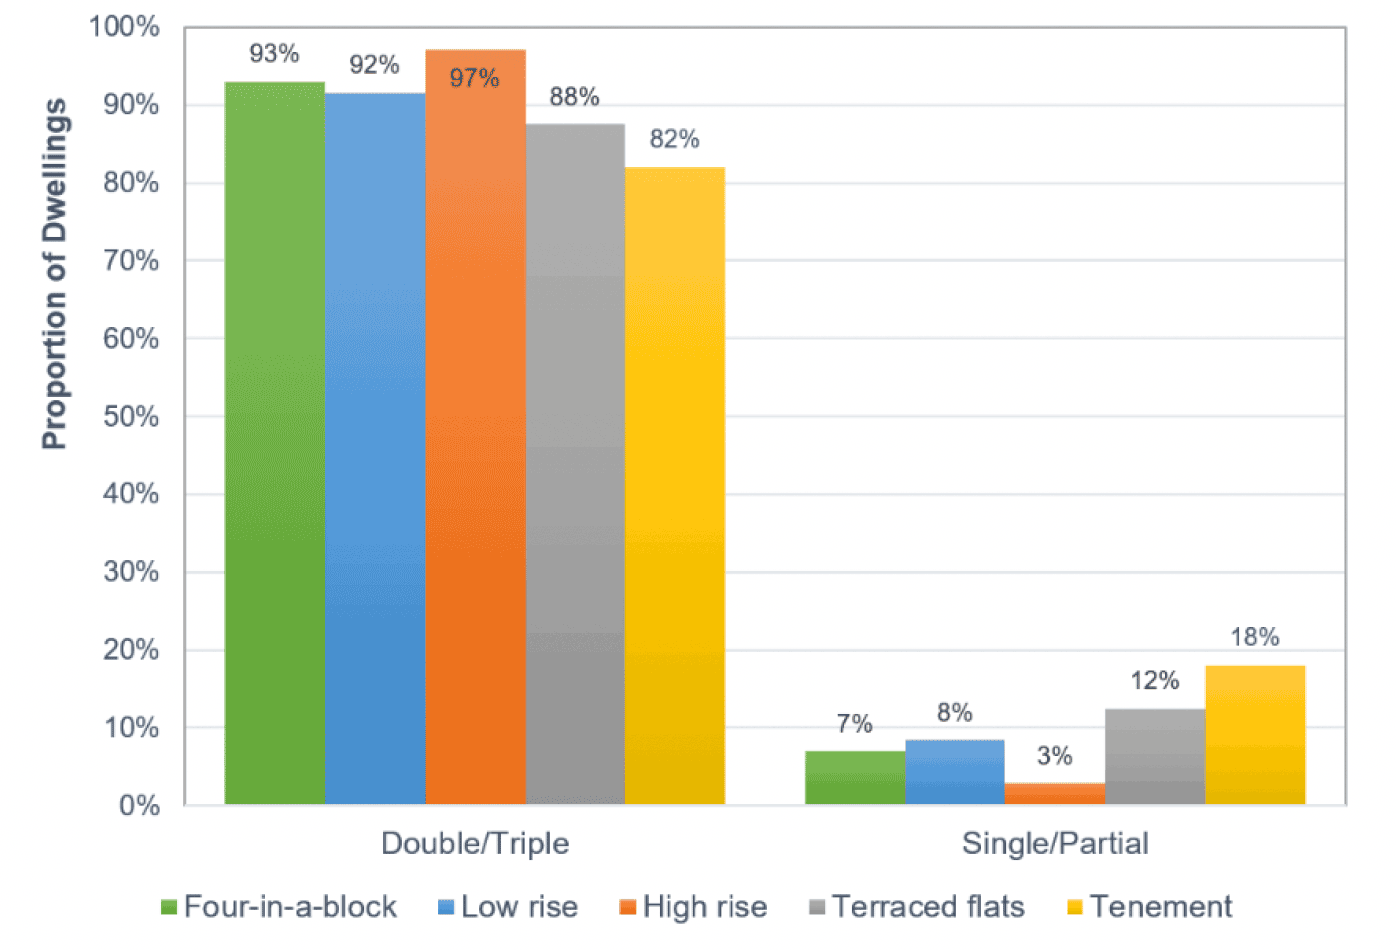
5.2.6. Glazing type
Figure 7 shows the glazing levels for the MOMU dataset which shows a high rate of double/triple glazing across MOMU archetypes. Tenements and terraced flats have the lowest relative glazing levels, due in part to older buildings. It should be noted that the EPC data does not indicate the quality of the double glazing and in many cases, it is likely it would be beneficial to replace it.
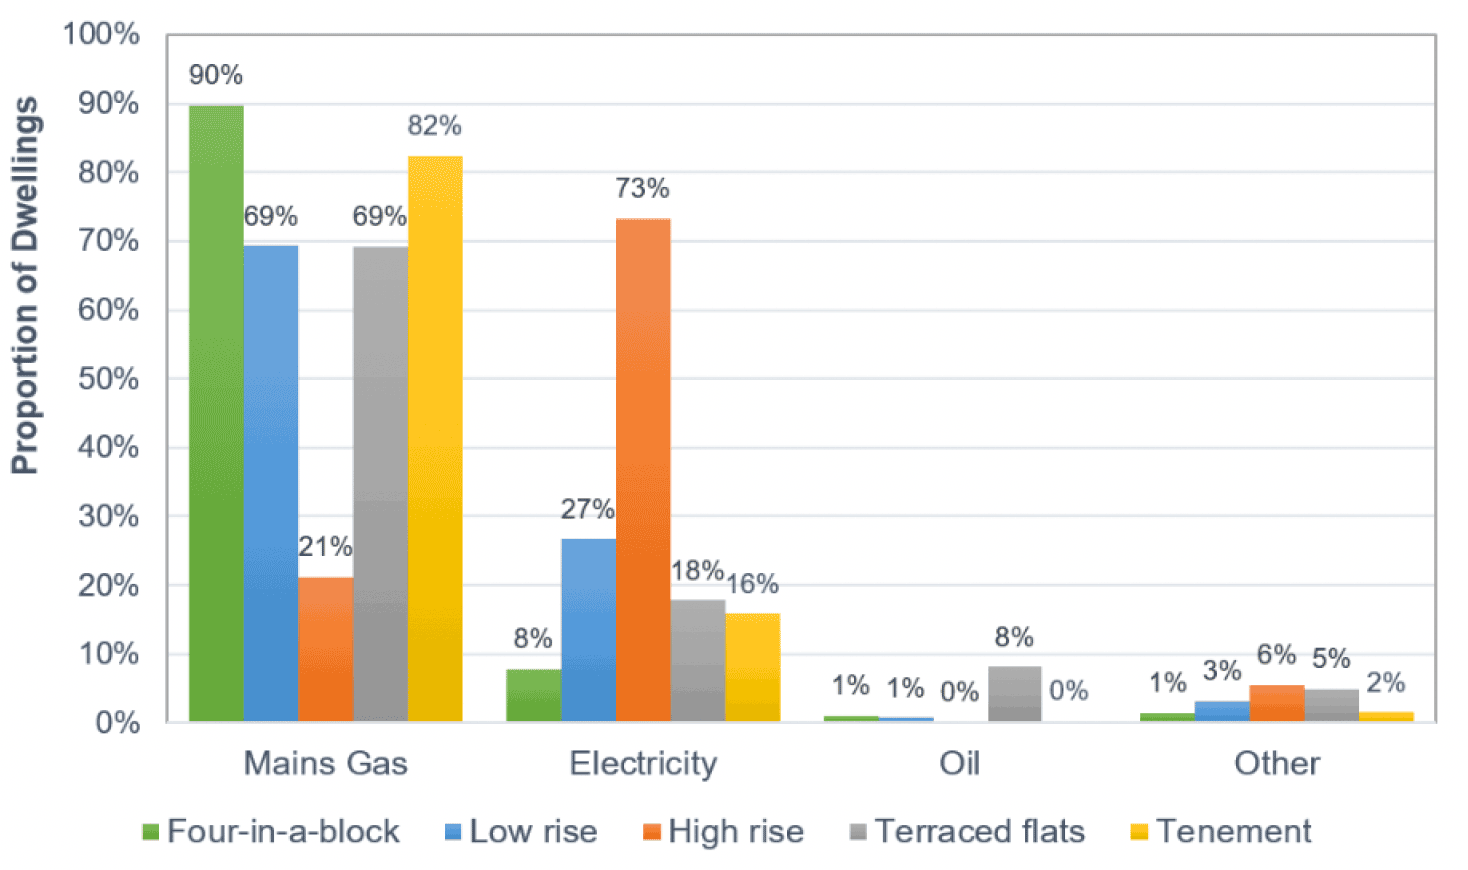
5.2.7. Main fuel type
Figure 8 shows the main heating fuel type in the MOMU properties. Four-in-a-blocks (90%) and tenements (82%) are mainly on gas. Electric heating accounts for nearly three quarters of high-rise dwellings. Oil is a relatively significant heating fuel for rural terraced flats.
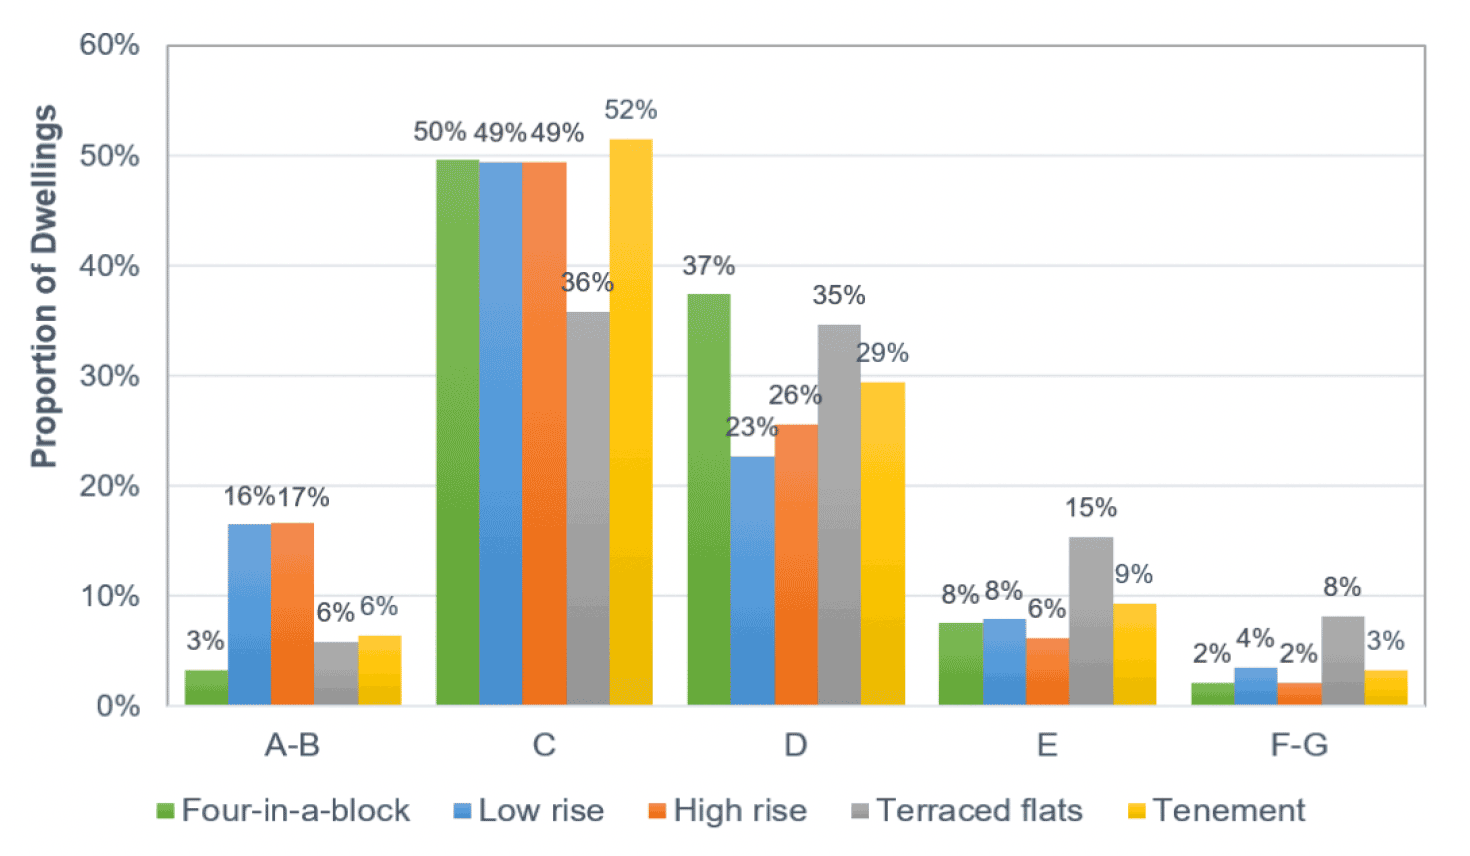
5.2.8. SAP band
Figure 9 shows the SAP bands[4] for the MOMU dataset. Low-rise and high-rise blocks have the highest energy efficiency (two thirds above SAP C). Tenements and four-in-a-blocks have medium efficiency whereas terraced flats have the lowest efficiency level (only 42% above SAP C).
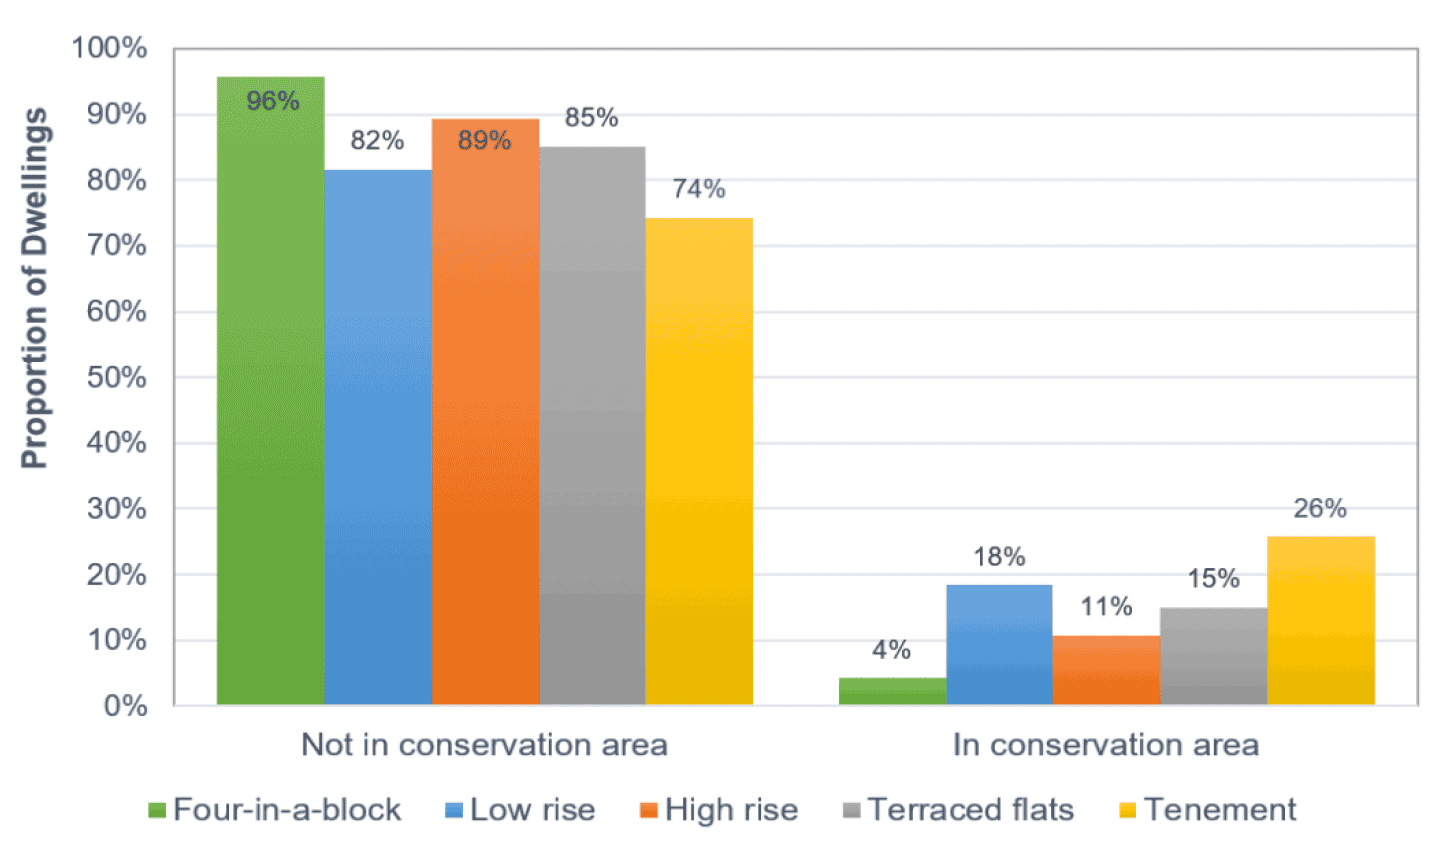
5.2.9. Conservation areas
Figure 10 shows the percentage of MOMU properties that lie within a conservation area. The properties within a conservation area may have to be treated differently to keep the look of the properties consistent with their cultural significance. For example, some properties in a conservation area may have to retain the same external appearance meaning that external wall insulation may not be suitable. Most MOMU properties are located outside conservation areas. Tenements (25%) have the highest concentration and nearly all four-in-a-block flats are located outside conservation areas (96%).
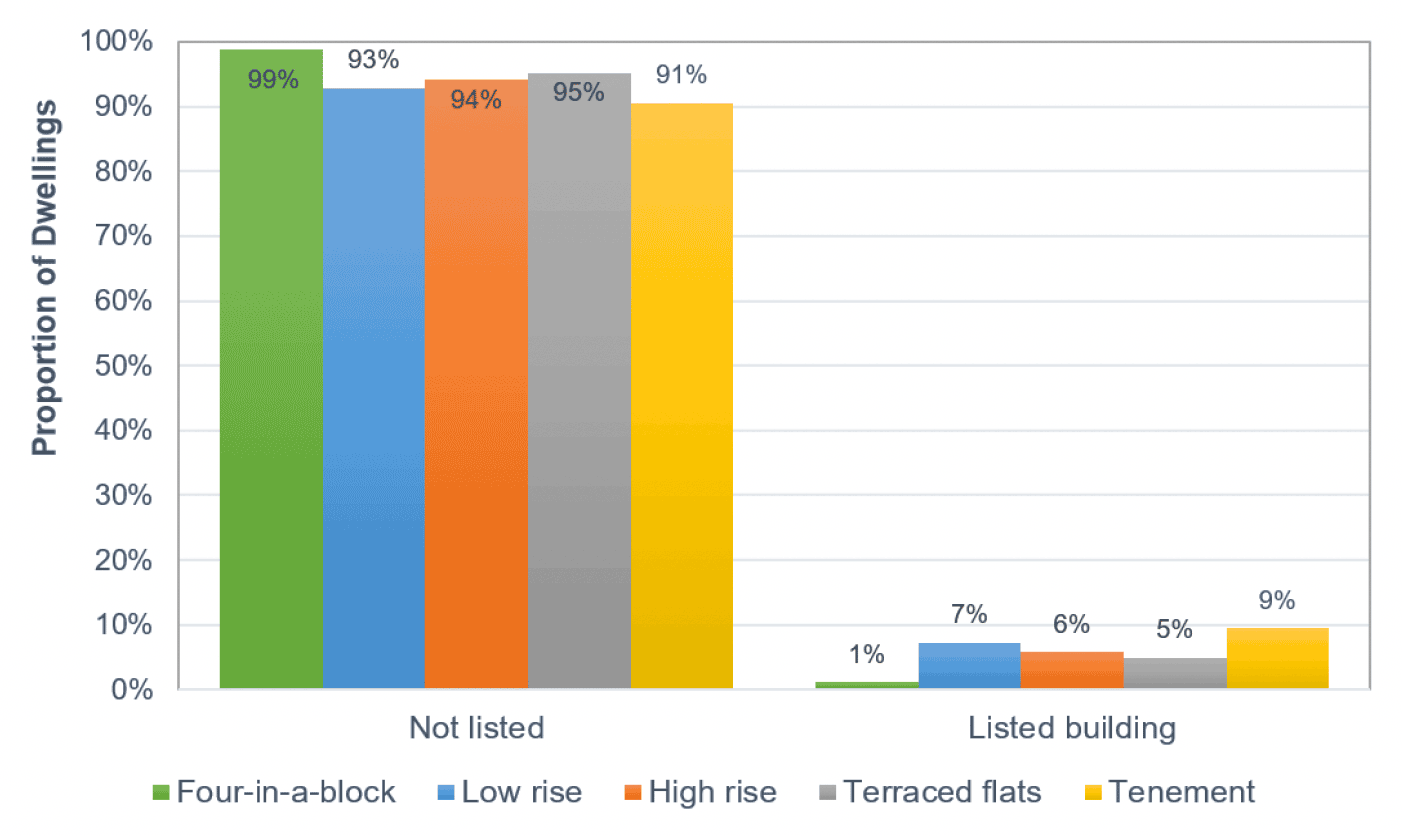
5.2.10. Listed building status
Figure 11 shows the percentage of properties that have listed status. As with properties in conservation areas, these properties will have specific requirements on how they can be treated. This would likely increase the cost of retrofitting these properties as specific techniques may need to be used to ensure it is completed sensitively to their history. All MOMU archetypes have at least 90% of their dwellings in unlisted buildings - tenements (9%) and low-rise blocks (7%) have the most listed buildings.
Contact
Email: leeanne.mullan@gov.scot
There is a problem
Thanks for your feedback