Housing Statistics for Scotland Quarterly Update: New Housebuilding and Affordable Housing Supply (published 28 March 2023)
A summary of activity in new build housing, affordable housing and long term empty properties and second homes in Scotland.
2. All-sector new housebuilding
Chart 1 on page 1 shows that annual all-sector new build starts and completions in the years to end September both showed a decreasing direction of trend immediately following the financial crisis in 2008. Starts fell to a low in 2011 and completions reached their lowest point in 2013. Following this, starts and completions then generally increased year on year up to the year ending September 2019. Starts and completions then dropped in the year to end September 2020 due to the impact of COVID-19 lockdown measures in the quarter April to June 2020, before both increasing again in the year to end September 2021. In the most recent year to end September 2022 starts have fallen while completions have continued to increase.
In the latest year to end September 2022, completions have increased by 10% to stand at 22,905 homes. Starts have decreased by 12% in the year to end September 2022 to 19,236 homes. Private-led completions rose by 7% (1,000 homes), local authority completions increased by 42% (840 homes), and housing association completions rose by 5% (183 homes). Private-led starts fell by 11% (1,774 homes) and local authority starts increased by 1% (11 homes), whilst housing association approvals fell by 26% (808 homes).
Chart 2 below presents the latest quarterly trends in completions to end September 2022, in which there were 6,374 all-sector completions in the latest quarter July to September 2022, an increase of 25% (1,288 homes) on the 5,086 completions in the same quarter in 2021.
The 4,255 private sector led completions in July to September 2022 is an increase of 24% (818 homes) on the 3,437 completions in the same quarter in 2021.
The 810 local authority completions in July to September 2022 is represents an increase of 66% (323 homes) on the 487 completions in the same quarter in 2021.
Meanwhile the 1,309 housing association completions in July to September 2022 is an increase of 13% (147 homes) on the 1,162 completions in the same quarter in 2021.
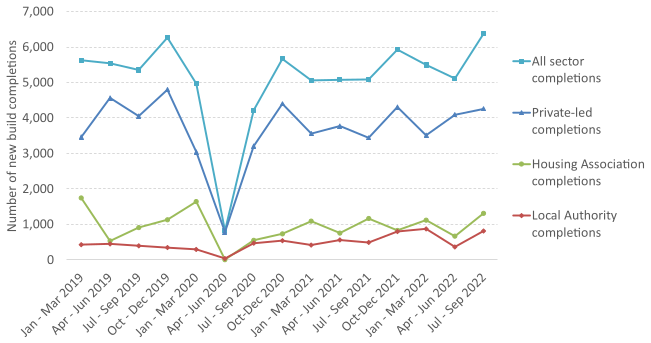
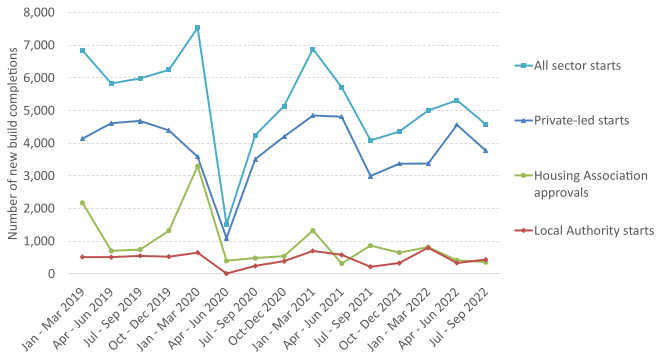
Chart 3 shows the equivalent quarterly trends in starts, in which there were 4,577 all-sector starts in the latest quarter July to September 2022. This is an increase of 12% (492 homes) on the 4,085 starts in the same quarter in 2021.
The 3,774 private sector led starts in July to September 2022 is an increase of 26% (777 homes) on the 2,997 starts in the same quarter in 2021.
The 439 local authority starts in July to September 2022 is an increase of 100% (219 homes) on the 220 starts in the same quarter in 2021.
Meanwhile the 364 housing association approvals in July to September 2022 is a decrease of 58% (504 homes) on the 868 approvals in the same quarter in 2021.
| All sector homes | Starts | Completions |
|---|---|---|
| Quarter Jul to Sep 2019 | 5,979 | 5,352 |
| Quarter Jul to Sep 2020 | 4,240 | 4,215 |
| Quarter Jul to Sep 2021 | 4,085 | 5,086 |
| Quarter Jul to Sep 2022 | 4,577 | 6,374 |
| Change from Q3 2021 to Q3 2022 | 492 | 1,288 |
| Change from Q3 2021 to Q3 2022 (%) | 12% | 25% |
| Year to Sep 2019 | 25,283 | 22,019 |
| Year to Sep 2020 | 19,528 | 16,265 |
| Year to Sep 2021 | 21,807 | 20,882 |
| Year to Sep 2022 | 19,227 | 22,905 |
| Change from 2021 to 2022 (%) | -2,580 | 2,023 |
| Change from 2021 to 2022 (%) | -12% | 10% |
Map A below shows that in the year to end September 2022, the highest new build rates were observed in the local authority areas of Midlothian, Aberdeen City, Highland, East Renfrewshire, Orkney, Perth & Kinross, South Lanarkhire, West Lothian and East Lothian which each had rates of more than 48 homes per 10,000 population.
The lowest rates were observed in Argyll & Bute, Inverclyde, Falkirk, Scottish Borders, West Dunbartonshire and East Dunbartonshire, which each had rates of 27 homes or fewer per 10,000 population.
Note that the all-sector completion rates calculations contain some estimated figures. Estimated figures have been used for private sector completions for East Dunbartonshire from October to December 2020, South Ayrshire from October to December 2021, Moray and Angus from July to September 2022, and Stirling from January to March 2022. Local authority completions are estimated for Highland from January to March 2021 to April to June 2022, and Aberdeen City and South Ayrshire from January to March 2022.

New housebuilding across UK countries
Chart 4a presents trends in the rates of all-sector new housebuilding completions per 10,000 population across each of the UK countries on a financial year basis (years to end March) to allow for comparisons with both the England financial year ‘net additional dwelling’ statistics and financial year rates derived from each of the quarterly UK series.
The England financial year ‘net additional dwellings' series is considered the primary and most comprehensive measure of housing supply in England. The quarterly new build statistical collection for England based on building control is not currently capturing all new build activity, and so is seen more as a leading indicator of activity throughout the year.
The chart shows that whilst Scotland had a higher rate of completions per 10,000 head of population than England (‘net additional dwellings’ series) over the period 2007/08 to 2013/14, that Scotland and England have seen broadly similar rates of housebuilding each year across the period 2014/15 to 2021/22, with the exception of 2020/21 in which Scotland saw a sharper fall, possibly due to the stricter COVID-19 lockdown restrictions that were in place for housing building in Scotland.
Figures for 2021/22 show that in in all four nations, the completions rate increased from the previous year, with Scotland having the largest increase, up to 39 homes per 10,000 population. This rate for 2021/22 is similar to the rate of 39 per 10,000 in Northern Ireland, and the rate of 37 in England (‘net additional dwellings’ series), and is above the rate of 17 in Wales.
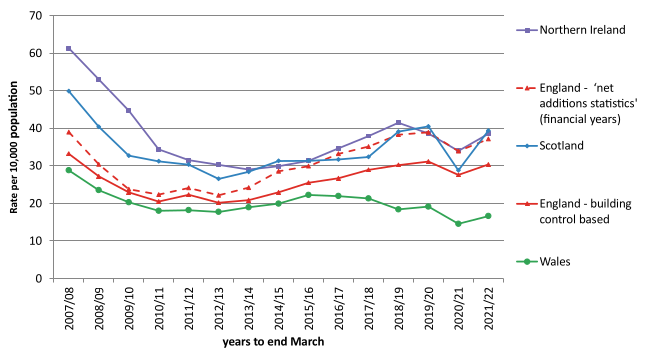
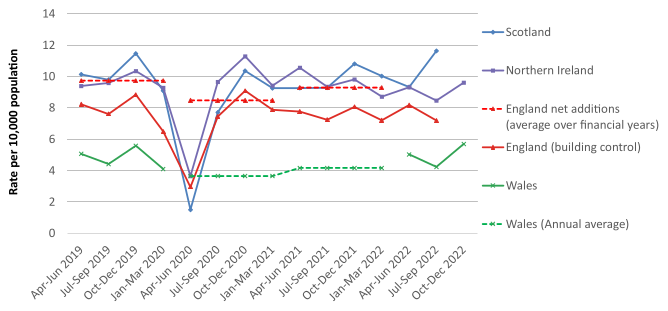
Chart 4b presents more recent trends in the rates of new housebuilding completions per 10,000 population across each of the UK countries on a quarterly basis[1], based on the latest published information available for each country. The England ‘net additional dwelling’ figures for the financial years 2019/20, 2020/21 and 2021/22 are also included as averages across each of the quarters within these years, to help demonstrate the difference in the relative level between this figure and the separate quarterly England building control based figures.
The chart shows the clear impact of COVID-19 lockdown restrictions on construction activity in the quarter April to June 2020, with the rates of new housebuilding per 10,000 population dropping compared to the same quarter in the previous year by 85% in Scotland, 64% in England (building control based figures), and 61% in Northern Ireland, which may reflect stricter lockdown restrictions for Scottish housing building compared to England and Northern Ireland.
Following this, the rates of new housebuilding in each of these countries subsequently increased back up to higher levels, although the quarterly rates for England and Northern Ireland have shown a slight downward trend over the quarters following the October to December 2020 quarter. The quarterly trend for Scotland has show more of a flat trend since the October to December quarter, although the latest quarter July to September 2022 is up on previous quarters.
Contact
There is a problem
Thanks for your feedback