Pesticide usage in Scotland: arable crops and potato stores 2016
This publication presents information from a survey of pesticide use on arable crops and potato stores in Scotland during 2016.
This document is part of a collection
2016 Pesticide usage
Winter barley
- An estimated 48,030 hectares of winter barley were grown in Scotland in 2016, a decrease of nine per cent since 2014
- 99 per cent of the crop was treated with a pesticide
- Pesticides were applied to 549,472 treated hectares
- 172,938 kilograms of pesticide were applied in total
- 42 per cent of pesticides applied were fungicides, 27 per cent herbicides, 20 per cent growth regulators, eight per cent seed treatments, three per cent insecticides and under one per cent molluscicides and sulphur ( Figure 15)
- Winter barley received on average 4.7 pesticide sprays (Table 1). These sprays included 2.8 fungicide applications and 2.3 herbicide applications (applied to 96 per cent and 95 per cent of the crop area respectively), 1.9 applications of growth regulators (applied to 92 per cent) and one application of insecticides (applied to 28 per cent)
- In relation to timings of pesticide applications, 67 per cent of insecticide applications were in October, 51 per cent of growth regulator applications were in April and 44 per cent of fungicide applications were in May ( Figure 16)
- Where reasons were given, 65 per cent of fungicide use was for disease control/precaution ( Figure 17). Where the disease was specified Rynchosporium was the most commonly reported
- 35 per cent of herbicide use was for general weed control, 27 per cent for desiccation/harvest aid, 15 per cent for annual broad-leaved weeds and 12 per cent for annual meadow grass ( Figure 18)
- 92 per cent of insecticide use was for aphids
- The most common varieties encountered were KWS Glacier and KWS Cassia, accounting for 19 and 16 per cent of the sample area respectively
- The average reported yield was 7.5 t/ha
Summary of pesticide use on winter barley:
| Pesticide group |
Formulation area treated (ha) |
Weight of pesticides applied (kg) |
% of crop area treated |
Most used formulations (ha) |
|---|---|---|---|---|
| Fungicides |
229,193 |
61,446 |
96 |
Chlorothalonil (40,181) |
| Herbicides |
146,121 |
64,101 |
95 |
Glyphosate (32,374) |
| Insecticides |
13,983 |
92 |
28 |
Lambda-cyhalothrin (9,398) |
| Growth regulators |
110,227 |
43,001 |
92 |
Chlormequat (38,321) |
| Molluscicides |
2,110 |
337 |
4 |
Metaldehyde (2,110) |
| Sulphur |
1,275 |
2,550 |
1 |
N/A |
| Seed treatments |
46,564 |
1,411 |
97 |
Prochloraz/triticonazole (19,533) |
N/A = not applicable
Figure 15 Use of pesticides on winter barley (percentage of total area treated with formulations) - 2016
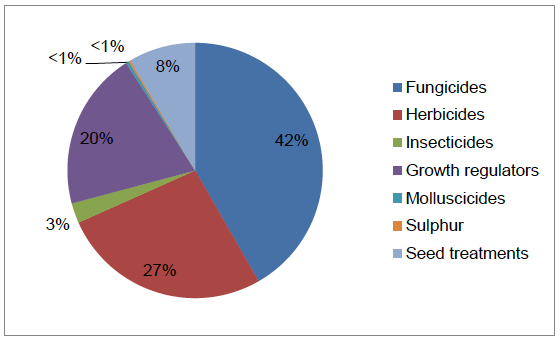
Figure 16 Timing of pesticide applications on winter barley - 2016
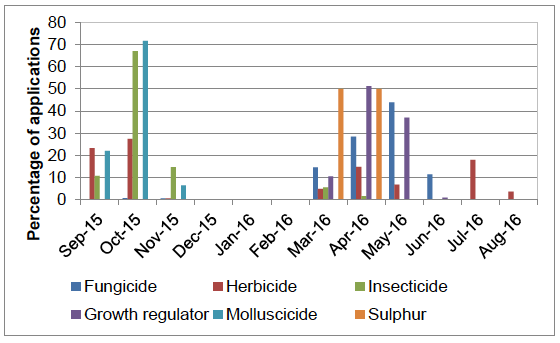
Figure 17 Reasons for use of fungicides on winter barley (where specified)
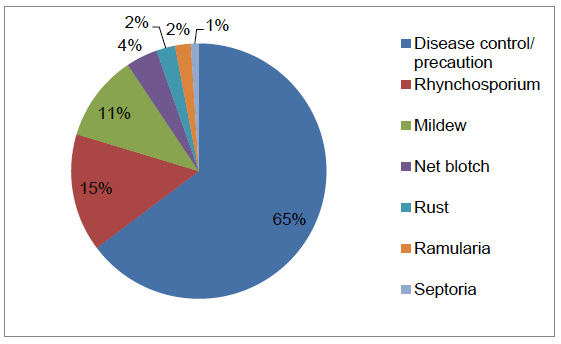
Figure 18 Reasons for use of herbicides on winter barley (where specified)
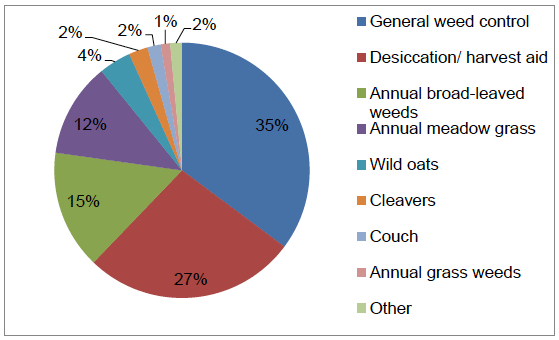
Note: 'Other' includes chickweed, brome and volunteer potatoes
Spring barley
- An estimated 238,901 hectares of spring barley were grown in Scotland in 2016, representing a decrease of 13 per cent since 2014
- 98 per cent of the crop was treated with a pesticide
- Pesticides were applied to 1,573,403 treated hectares
- 395,732 kilograms of pesticide were used in total on the crop
- 42 per cent of pesticides applied were fungicides, 40 per cent herbicides, 14 per cent seed treatments, three per cent growth regulators, one per cent insecticides and under one per cent molluscicides and sulphur ( Figure 19)
- The spring barley crop received on average 2.6 pesticide applications (Table 1). These included 1.8 fungicide applications and 1.7 herbicide applications (applied to 93 per cent and 96 per cent of the crop area respectively and 1.1 applications of growth regulators (applied to 18 per cent)
- In relation to timings of pesticide applications, 42 per cent of herbicides were applied in May and 72 per cent of insecticides were applied in June ( Figure 20). Fungicides and growth regulators were applied from May to July
- Where reasons were given, 79 per cent of fungicide use was for disease control/precaution ( Figure 21) Where the disease was specified Rhynchosporium was the most commonly reported
- 61 per cent of herbicide use was for general weed control, 12 per cent for annual broad-leaved weeds and 12 per cent for desiccation/harvest aid ( Figure 22)
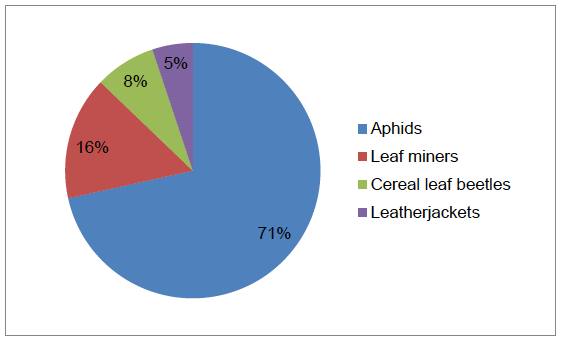
- 71 per cent of insecticide was for aphids and 16 per cent was for leaf miners ( Figure 23)
- Concerto was the most common variety, accounting for 58 per cent of the sample area
- The average reported yield was 5.8 t/ha
Summary of pesticide use on spring barley:
| Pesticide group |
Formulation area treated (ha) |
Weight of pesticides applied (kg) |
% of crop area treated |
Most used formulations (ha) |
|---|---|---|---|---|
| Fungicides |
661,513 |
160,525 |
93 |
Chlorothalonil (133,652) |
| Herbicides |
621,755 |
208,422 |
96 |
Metsulfuron-methyl/ Thifensulfuron-methyl (92,288) |
| Insecticides |
18,228 |
372 |
8 |
Lambda-cyhalothrin (16,091) |
| Growth regulators |
50,830 |
10,473 |
18 |
Chlormequat (13,423), Trinexapac-ethyl (13,203) |
| Molluscicides |
141 |
49 |
<0.5 |
Metaldehyde (141) |
| Sulphur |
1,394 |
10,480 |
1 |
N/A |
| Seed treatments |
219,543 |
5,410 |
92 |
Fluopyram/prothioconazole/ tebuconazole (94,126) |
N/A = not applicable
Figure 19 Use of pesticides on spring barley (percentage of total area treated with formulations) - 2016
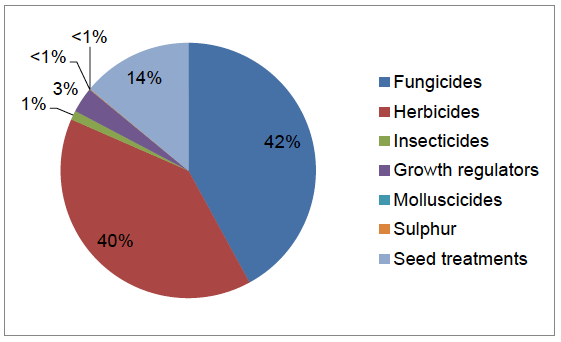
Figure 20 Timing of pesticide applications on spring barley - 2016
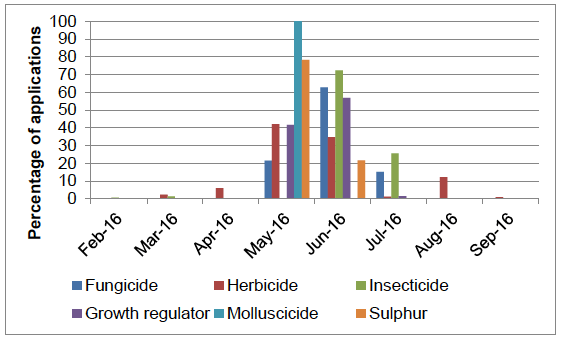
Figure 21 Reasons for use of fungicides on spring barley (where specified)
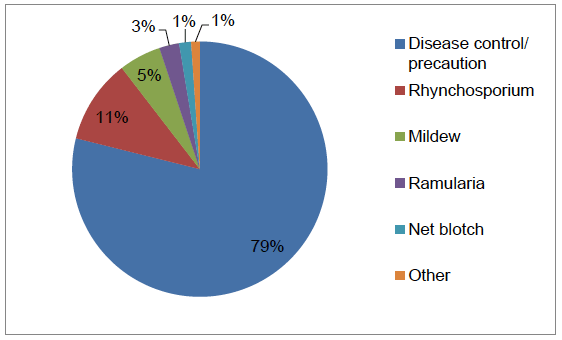
Note: 'Other' includes ear diseases, fusarium and keep green
Figure 22 Reasons for use of herbicides on spring barley (where specified)
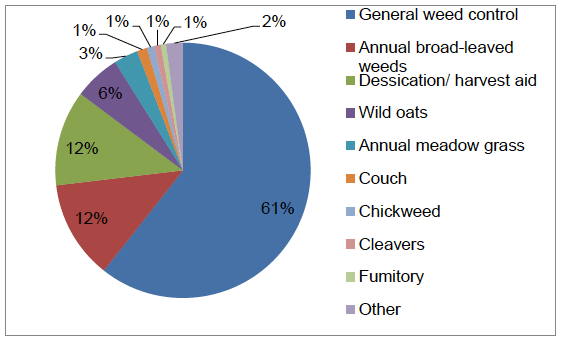
Other includes volunteer rape, field pansy, marigolds, knotgrass, mayweed, annual grass weeds, volunteer potatoes, speedwell, docks and redshank
Figure 23 Reasons for use of insecticides on spring barley (where specified)
Winter wheat
- An estimated 102,753 hectares of winter wheat were grown in Scotland in 2014. This represents a decrease of three per cent since 2014.
- 99 per cent of the crop was treated with a pesticide
- Pesticides were applied to 1,526,366 treated hectares
- 487,552 kilograms of pesticides were applied to the crop
- 51 per cent of pesticides applied were fungicides, 20 per cent herbicides, 19 per cent growth regulators, seven per cent seed treatments, two per cent insecticides, one per cent molluscicides and under one per cent sulphur ( Figure 24)
- The winter wheat crop received on average 5.3 pesticide applications (Table 1). These included 3.7 fungicide and 2.2 herbicide applications (applied to 99 per cent and 98 per cent of the crop area respectively), 1.9 applications of growth regulators (applied to 98 per cent), 1.2 insecticide applications (applied to 27 per cent) and 1.3 molluscicide applications (applied to 12 per cent)
- Molluscicide applications were between September and February; fungicide and growth regulator applications were applied between March and June ( Figure 25). 30 per cent of herbicide applications were in October and insecticide applications were mainly in October and June
- Where reasons were given, 62 per cent of fungicide use was for disease control/precaution ( Figure 26). Where the disease was specified Septoria was the most commonly reported
- 44 per cent of herbicide use was for general weed control and 20 per cent for annual broad leaved weeds ( Figure 27)
- 99 per cent of insecticide applications were for aphids and one per cent leatherjackets
- The most common varieties encountered were Istabraq, Viscount, Myriad and Leeds accounting for 13, 13, 12 and 11 per cent of the sample area respectively
- The average reported yield was 9 t/ha
Summary of pesticide use on winter wheat:
| Pesticide group |
Formulation area treated (ha) |
Weight of pesticides applied (kg) |
% of crop area treated |
Most used formulations (ha) |
|---|---|---|---|---|
| Fungicides |
783,338 |
228,684 |
99 |
Chlorothalonil (220,141) |
| Herbicides |
310,331 |
119,221 |
98 |
Glyphosate (40,350), Pendimethalin/picolinafen (40,048) |
| Insecticides |
31,718 |
800 |
27 |
Lambda-cyhalothrin (26,696) |
| Growth regulators |
280,413 |
122,992 |
98 |
Chlormequat (117,740) |
| Molluscicides |
16,169 |
2,042 |
12 |
Metaldehyde (13,432) |
| Sulphur |
4,325 |
7,681 |
3 |
N/A |
| Seed treatments |
100,073 |
6,132 |
95 |
Prochloraz/triticonazole (35,562) |
N/A = not applicable
Figure 24 Use of pesticides on winter wheat (percentage of total area treated with formulations) - 2016
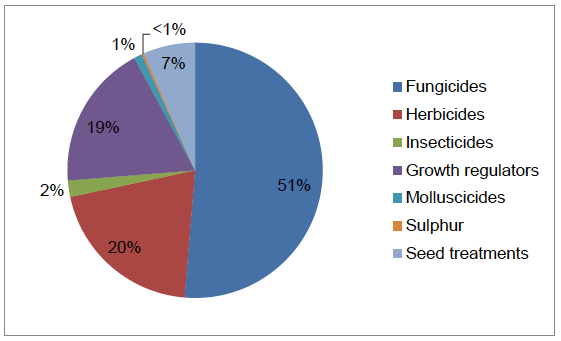
Figure 25 Timing of pesticide applications on winter wheat - 2016
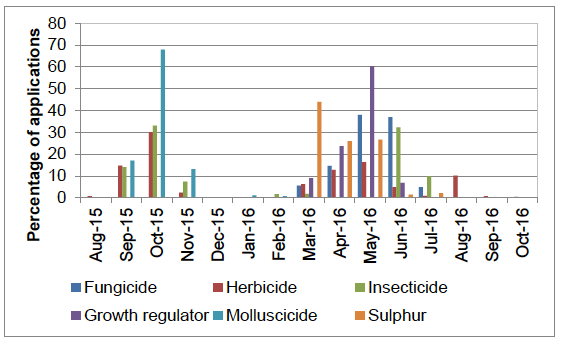
Figure 26 Reasons for use of fungicides on winter wheat (where specified)
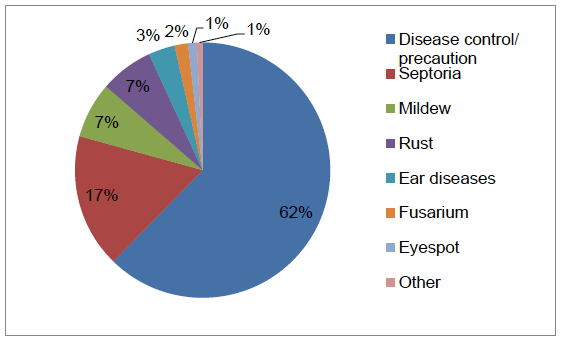
Note: 'Other' includes Sooty mould
Figure 27 Reasons for use of herbicides on winter wheat (where specified)
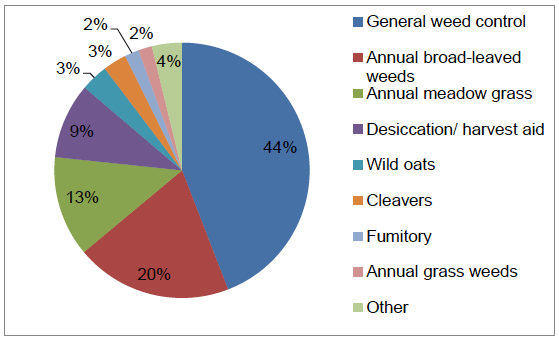
Note: 'Other' includes brome, mayweed, chickweed, ryegrass, volunteer beans, volunteer cereals, volunteer rape, volunteer potatoes, forget-me-not, groundsel, nettles and speedwell
Spring wheat
This crop was not recorded separately in the Agricultural Census. Based upon the proportions of spring and winter wheat encountered in the survey, it was estimated that 6,843 hectares of spring wheat were grown in Scotland in 2016. This represents an increase of 132 per cent from the 2014 survey.
- 93 per cent of the crop was treated with a pesticide
- Pesticides were applied to 31,481 treated hectares
- 9,408 kilograms of pesticides were applied to the crop
- 37 per cent of pesticides applied were herbicides, 33 per cent were fungicides, 18 per cent seed treatments, seven per cent growth regulators, four per cent sulphur and one per cent insecticides ( Figure 28)
- No molluscicide applications were recorded on spring wheat
- The spring wheat crop received on average 2.1 pesticide applications (Table 1) These included 1.4 herbicide applications (applied to 91 per cent of the crop area), 1.7 fungicide applications (applied to 46 per cent) and 1.3 growth regulator applications (applied to 18 per cent)
- In relation to timings of pesticide applications, 47 per cent of herbicides were applied in June ( Figure 29). Growth regulators were applied in May and June and fungicides were applied from May to July
- Where reasons were given, 73 per cent of fungicide use was for disease control/precaution ( Figure 30)
- 83 per cent of herbicide use was for general weed control ( Figure 31)
- Where reasons were given, all insecticide use was for wheat bulb fly
- The most common varieties encountered were Tybalt and Belepi, accounting for 28 and 21 per cent of the sampled area respectively
- The average reported yield was 5.5 t/ha
Summary of pesticide use on spring wheat:
| Pesticide group |
Formulation area treated (ha) |
Weight of pesticides applied (kg) |
% of crop area treated |
Most used formulations (ha) |
|---|---|---|---|---|
| Fungicides |
10,208 |
2,568 |
46 |
Chlorothalonil (3,124) |
| Herbicides |
11,690 |
3,450 |
91 |
Fluroxypyr (3,231) |
| Insecticides |
216 |
60 |
3 |
Lambda-cyhalothrin (134) |
| Growth regulators |
2,326 |
1,122 |
18 |
Chlormequat (1,388) |
| Sulphur |
1,331 |
2,130 |
2 |
N/A |
| Seed treatments |
5,708 |
78 |
83 |
Fludioxonil (4,918) |
N/A = not applicable
Figure 28 Use of pesticides on spring wheat (percentage of total area treated with formulations) - 2016
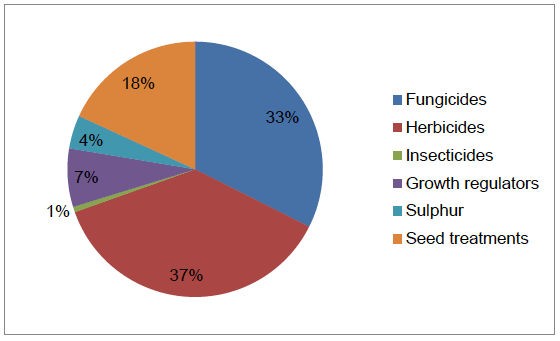
Figure 29 Timing of pesticide applications on spring wheat - 2016
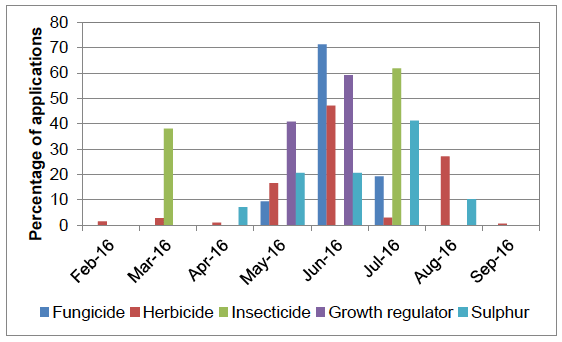
Figure 30 Reasons for use of fungicides on spring wheat (where specified) - 2016
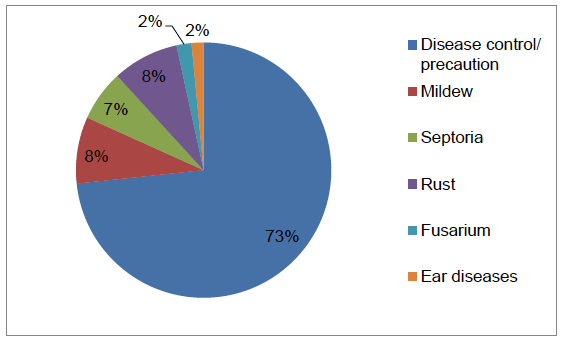
Figure 31 Reasons for use of herbicides on spring wheat (where specified) - 2016
Winter oats
- An estimated 8,091 hectares of winter oats were grown in Scotland in 2016, an increase of one per cent since 2014
- 94 per cent of the winter oat crop was treated with a pesticide
- Pesticides were applied to 76,006 treated hectares
- 17,612 kilograms of pesticides were applied to the crop
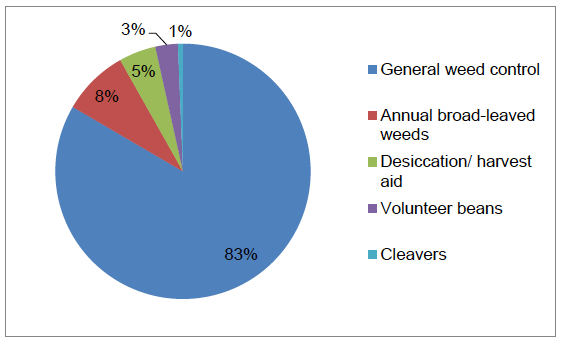
- 38 per cent of pesticides applied were fungicides, 28 per cent herbicides, 20 per cent growth regulators, eight per cent seed treatments, six per cent insecticides and under one per cent molluscicides ( Figure 32)
- No sulphur was applied to the winter oats crop
- The winter oats crop received on average 4.4 pesticide applications (Table 1). These included 2.6 fungicide, 2.5 herbicide and 1.3 growth regulator applications (applied to 92 per cent of the crop area) and one insecticide application (applied to 55 per cent)
- In relation to timings of pesticide applications, 36 per cent of herbicides were applied in May and 56 per cent of insecticide applications were applied in June ( Figure 33). Fungicides and growth regulators were applied from March to June
- Where reasons were given, 47 per cent of fungicide applications were for general disease control ( Figure 34). Where the disease was specified, mildew was the most commonly reported
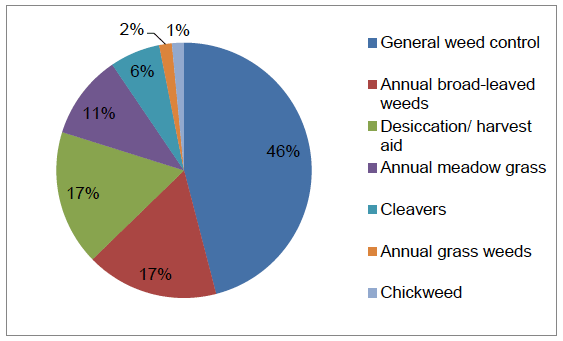
- 46 per cent of herbicide use was for general weed control, 17 per cent was for annual broad-leaved weeds and 17 per cent was for desiccation/harvest aid ( Figure 35)
- Where reasons were given, all insecticide use was for control of aphids
- The most common variety encountered was Gerald accounting for 65 per cent of the sampled area
- The average reported yield was 7.4 t/ha
Summary of pesticide use on winter oats
| Pesticide group |
Formulation area treated (ha) |
Weight of pesticides applied (kg) |
% of crop area treated |
Most used formulations (ha) |
|---|---|---|---|---|
| Fungicides |
28,580 |
3,295 |
92 |
Proquinazid (4,673), Fenpropimorph (4,653) |
| Herbicides |
21,461 |
6,592 |
92 |
Glyphosate (3,797), Fluroxypyr (3,688), Diflufenican/flufenacet (3,574) |
| Insecticides |
4,559 |
23 |
55 |
Lambda-cyhalothrin (3,770) |
| Growth regulators |
15,041 |
7,485 |
92 |
Chlormequat (7,376) |
| Molluscicides |
100 |
8 |
1 |
Ferric phosphate (50), Metaldehyde (50) |
| Seed treatments |
6,264 |
210 |
77 |
Fludioxonil (1,908) |
Figure 32 Use of pesticides on winter oats (percentage of total area treated with formulations) – 2016
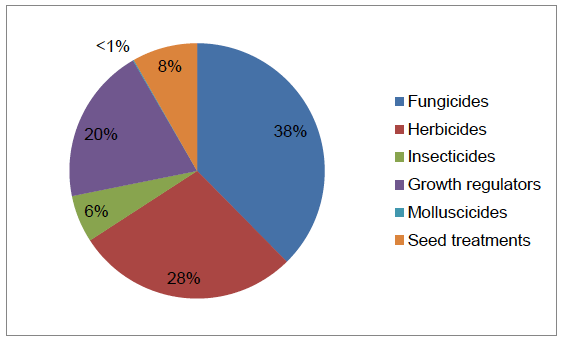
Figure 33 Timing of pesticide applications on winter oats – 2016
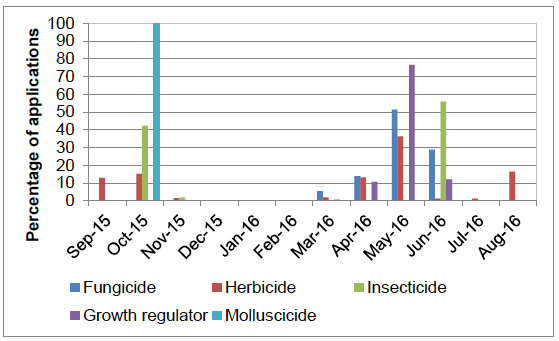
Figure 34 Reasons for use of fungicides on winter oats (where specified)
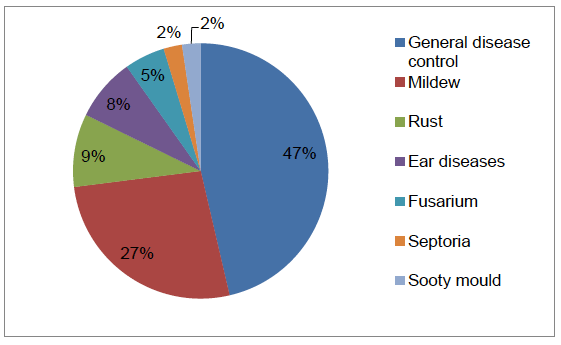
Figure 35 Reasons for use of herbicides on winter oats (where specified)
Spring oats
- An estimated 23,119 hectares of spring oats were grown in 2016, representing a 36 per cent increase from 2014
- 87 per cent of the spring oat crop was treated with a pesticide
- Pesticide formulations were applied to 129,689 treated hectares
- 36,253 kilograms of pesticides were used in total on the crop
- 33 per cent of pesticides applied were fungicides, 33 per cent herbicides, 16 per cent growth regulators, 14 per cent seed treatments, four per cent insecticides and under one per cent sulphur ( Figure 36)
- No molluscicides were applied to the spring oats crop
- The spring oat crop received on average 2.6 pesticide sprays (Table 1). These included 1.6 herbicide applications (applied to 83 per cent of the crop area), 1.8 fungicide applications (applied to 77 per cent), 1.1 growth regulator applications (applied to 68 per cent) and an average of one insecticide application (applied to 22 per cent)
- 43 per cent of herbicides were applied in May and 70 per cent of insecticides were applied in June ( Figure 37). Fungicides and growth regulators were applied from May to July
- Where reasons were given, 68 per cent of fungicide use was for disease control/precaution ( Figure 38). Where the disease was specified, mildew was the most commonly reported
- 74 per cent of herbicide use was for general weed control and 12 per cent was for annual broad-leaved weeds ( Figure 39)
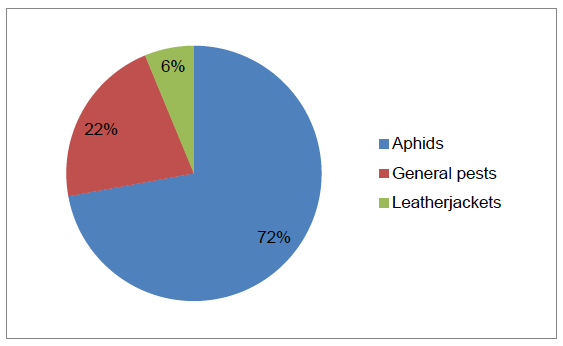
- 72 per cent of insecticide use was for aphids and 22 per cent was for general pests ( Figure 40)
- The most common varieties encountered were Canyon, Firth and Aspen, accounting for 30, 28 and 21 per cent of the sample area surveyed respectively
- The average reported yield was 6.3 t/ha
Summary pesticide use on spring oats
| Pesticide group |
Formulation area treated (ha) |
Weight of pesticides applied (kg) |
% of crop area treated |
Most used formulations (ha) |
|---|---|---|---|---|
| Fungicides |
42,798 |
6,034 |
77 |
Proquinazid (6,948) |
| Herbicides |
43,317 |
16,297 |
83 |
Mecoprop-P(6,811), Metsulfuron-methyl/tribenuron-methyl (6,804),Glyphosate (6,540) |
| Insecticides |
5,090 |
92 |
22 |
Lambda-cyhalothrin (4,995) |
| Growth regulators |
20,455 |
13,150 |
68 |
Chlormequat (11,990) |
| Sulphur |
87 |
139 |
<0.5 |
N/A |
| Seed treatments |
17,942 |
541 |
78 |
Fludioxonil (7,304) |
N/A = not applicable
Figure 36 Use of pesticides on spring oats (percentage of total area treated with formulations) - 2016
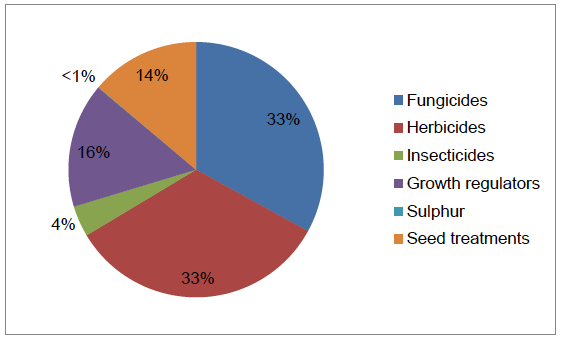
Figure 37 Timing of pesticide applications on spring oats - 2016
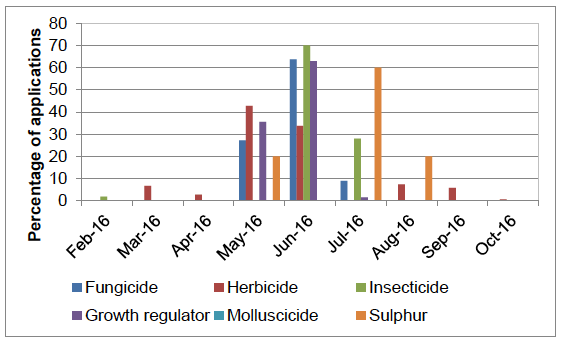
Figure 38 Reasons for use of fungicides on spring oats (where specified)
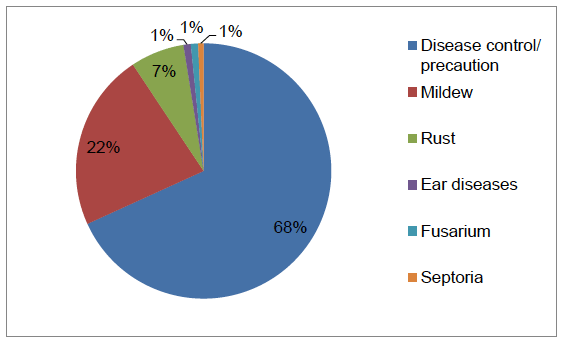
Figure 39 Reasons for use of herbicides on spring oats (where specified)
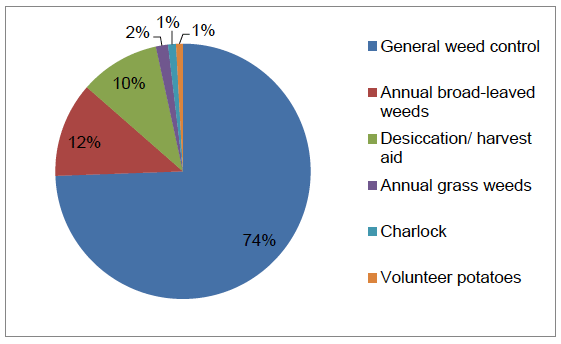
Figure 40 Reasons for use of insecticides on spring oats (where specified)
Winter oilseed rape
- An estimated 30,142 hectares of winter oilseed rape were grown in Scotland in 2016, representing a 17 per cent decrease from 2014
- 99 per cent of the winter oilseed rape crop was treated with a pesticide
- Pesticides were applied to 286,833 treated hectares
- 93,171 kilograms of pesticide were applied to the crop
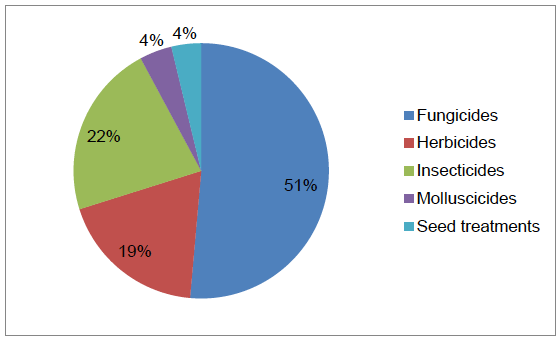
- 35 per cent of pesticides applied were fungicides, 32 per cent herbicides, 15 per cent insecticides, nine per cent seed treatments, six per cent molluscicides, two per cent growth regulators and one per cent sulphur ( Figure 41)
- The winter oilseed rape crop received on average 5.9 pesticide applications (Table 1). These included 2.9 fungicide and 2.6 herbicide applications (applied to 99 per cent and 98 per cent of the crop area respectively), 1.8 insecticide applications (applied to 79 per cent), 1.3 molluscicide applications (applied to 43 per cent) and one growth regulator application (applied to 20 per cent)
- 29 per cent of herbicides and 47 per cent of molluscicides were applied in September after sowing, 89 per cent of growth regulators were applied in April, 38 per cent of fungicides and 30 per cent of insecticide applications were in May ( Figure 42)
- Where reasons were given, 48 per cent of fungicide use was for general disease control ( Figure 43). Where the disease was specified, light leaf spot was the most commonly reported
- 27 per cent of herbicide use was for desiccation/harvest aid and 26 per cent was for general weed control ( Figure 44)
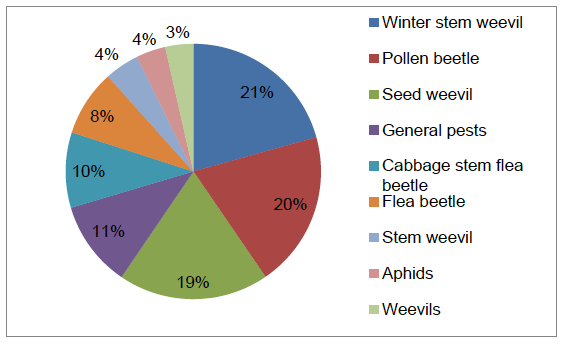
- 21 per cent of insecticide use was for winter stem weevil, 20 per cent was for pollen beetle and 19 per cent was for seed weevil ( Figure 45)
- The most common varieties encountered were Anastasia and Mentor, accounting for 20 and 18 per cent of the sample area respectively
- The average reported yield was 3.7 t/ha
Summary of pesticide use on winter oilseed rape
| Pesticide group |
Formulation area treated (ha) |
Weight of pesticides applied (kg) |
% of crop area treated |
Most used formulations (ha) |
|---|---|---|---|---|
| Fungicides |
100,681 |
19,361 |
99 |
Prothioconazole/tebuconazole (18,510),Prothioconazole (17,112) |
| Herbicides |
90,409 |
56,768 |
98 |
Glyphosate (23,010) |
| Insecticides |
43,782 |
805 |
79 |
Lambda-cyhalothrin (22,438) |
| Growth regulators |
5,965 |
1,098 |
20 |
Mepiquat chloride/ Metconazole (5,965) |
| Molluscicides |
16,234 |
1,846 |
43 |
Metaldehyde (14,353) |
| Sulphur |
2,973 |
12,995 |
5 |
N/A |
| Seed treatments |
26,789 |
298 |
89 |
Prochloraz/thiram (25,368) |
N/A – not applicable
Figure 41 Use of pesticides on winter oilseed rape (percentage of total area treated with formulations) - 2016
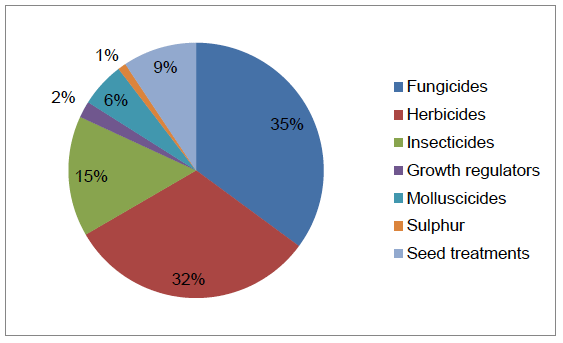
Figure 42 Timing of pesticide applications on winter oilseed rape - 2016
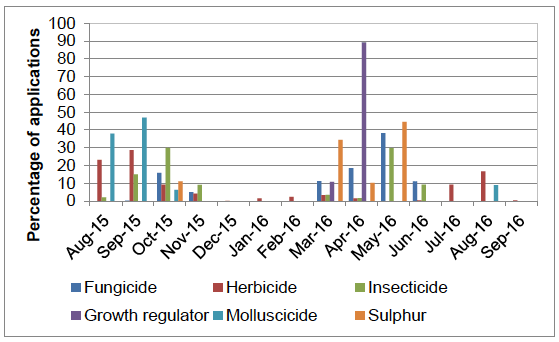
Figure 43 Reasons for use of fungicides on winter oilseed rape (where specified)
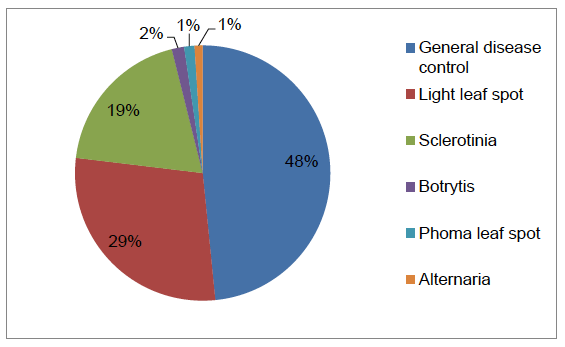
Figure 44 Reasons for use of herbicides on winter oilseed rape (where specified)
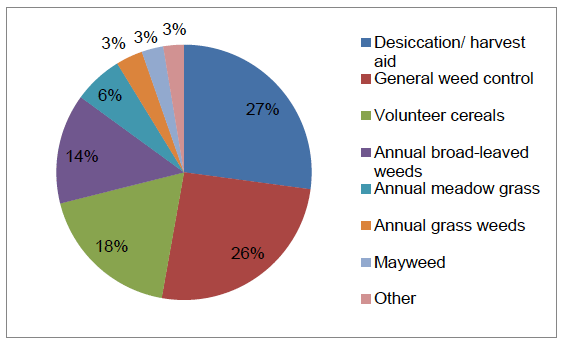
Note: 'Other' includes brome, wild oats, cleavers and ryegrass
Figure 45 Reasons for use of insecticides on winter oilseed rape (where specified)
Seed potatoes
- An estimated 12,760 hectares of seed potatoes were grown in Scotland in 2016, a four per cent decrease from 2014
- 100 per cent of the seed potato crop was treated with a pesticide
- Pesticides were applied to 299,402 treated hectares
- 101,861 kilograms of pesticide were applied in total
- 51 per cent of pesticides applied were fungicides, 22 per cent insecticides/nematicides, 19 per cent herbicides, four per cent molluscicides and four per cent seed treatments ( Figure 46)
- No growth regulators or sulphur were applied to the seed potato crop
- The seed potato crop received on average 11.1 pesticide applications (Table 1). These sprays included 8.7 fungicide applications (applied to 100 per cent of the crop area), 2.3 herbicide applications (applied to 95 per cent), 5.6 insecticide/nematicide applications (applied to 79 per cent) and 2.9 molluscicide applications (applied to 34 per cent)
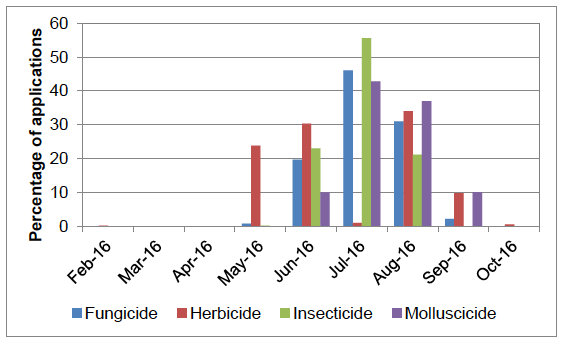
- In relation to timing of pesticide applications, 46 per cent of fungicide, 56 per cent of insecticide/nematicide and 43 per cent of molluscicide applications were applied in July, 34 per cent of herbicide applications were in August ( Figure 47)
- Where reasons were given, over 99 per cent of fungicide use was for blight
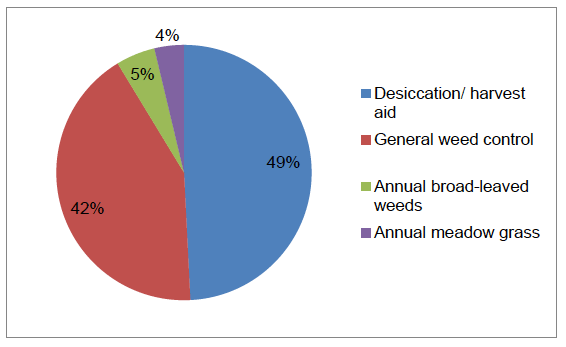
- 49 per cent of herbicide use was for desiccation/ harvest aid and
- 42 per cent was for general weed control ( Figure 48)
- The only specified reason for use of insecticides on seed potatoes was for aphids
- The most common variety encountered was Hermes, accounting for 16 per cent of the sample area
- The average reported yield was 36.5 t/ha
Summary of pesticide use on seed potatoes
| Pesticide group |
Formulation area treated (ha) |
Weight of pesticides applied (kg) |
% of crop area treated |
Most used formulations (ha) |
|---|---|---|---|---|
| Fungicides |
153,885 |
70,353 |
100 |
Cymoxanil (26,642),cyazofamid (25,695) |
| Herbicides |
56,119 |
21,887 |
95 |
Diquat (26,004) |
| Insecticides/ nematicides |
65,899 |
2,271 |
79 |
Lambda-cyhalothrin (26,378) |
| Molluscicides |
12,247 |
1,329 |
34 |
Metaldehyde (10,548) |
| Seed treatments |
11,253 |
6,021 |
85 |
Pencycuron (7,097) |
Figure 46 Use of pesticides on seed potatoes (percentage of total area treated with formulations) - 2016
Note: insecticides include nematicides
Figure 47 Timing of pesticide applications on seed potatoes - 2016
Note: insecticides include nematicides
Figure 48 Reasons for use of herbicides on seed potatoes (where specified)
Ware potatoes
- An estimated 14,766 hectares of ware potatoes were grown in Scotland in 2016, a decrease of three per cent since 2014
- 98 per cent of the crop was treated with a pesticide
- Pesticides were applied to 332,979 treated hectares
- 155,171 kilograms of pesticide were applied in total
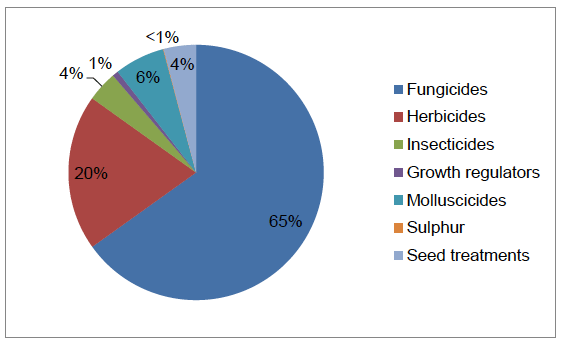
- 65 per cent of pesticides applied were fungicides, 20 per cent herbicides, six per cent molluscicides, four per cent insecticides/nematicides, four per cent seed treatments, one per cent growth regulators and under one per cent sulphur ( Figure 49)
- The ware potato crop received on average 13.5 pesticide sprays (Table 1). These sprays included 10.3 fungicide and 2.4 herbicide applications (applied to 98 per cent of the crop area), 2.5 molluscicide applications (applied to 55 per cent), 1.7 insecticide/nematicide applications (applied to 51 per cent) and one growth regulator application (applied to 17 per cent)
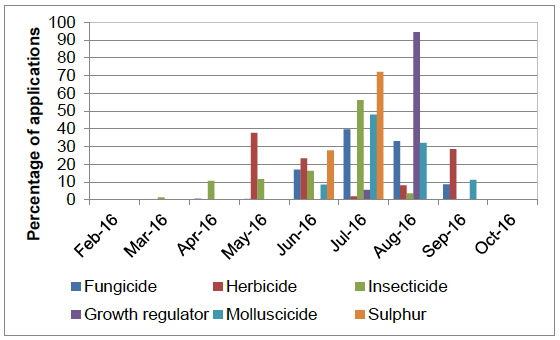
- 38 per cent of herbicide applications were in May, 40 per cent of fungicide applications, 56 per cent of insecticide applications and 48 per cent of molluscicide applications were in July. 94 per cent of growth regulator applications were in August ( Figure 50)
- Where reasons were given, over 99 per cent of fungicide use was for blight and under one per cent was for Alternaria and rust.
- 52 per cent of herbicide use was for general weed control and 41 per cent was for desiccation/harvest aid ( Figure 51)
- 85 per cent of insecticide/nematicide use was for aphids and 15 per cent was for nematodes
- The most common varieties encountered were Osprey and Maris Piper, accounting for 21 and 16 per cent of the sampled area respectively
- The average reported yield was 47.3 t/ha
Summary of pesticide use on ware potatoes
| Pesticide group |
Formulation area treated (ha) |
Weight of pesticides applied (kg) |
% of crop area treated |
Most used formulations (ha) |
|---|---|---|---|---|
| Fungicides |
216,811 |
104,862 |
98 |
Cyazofamid (36,409) |
| Herbicides |
65,808 |
27,482 |
98 |
Diquat (30,200) |
| Insecticides/ nematicides |
12,820 |
7,895 |
51 |
Esfenvalerate (5,585) |
| Growth regulators |
2,515 |
7,338 |
17 |
Maleic hydrazide (2,515) |
| Molluscicides |
21,185 |
2,177 |
55 |
Metaldehyde (16,816) |
| Sulphur |
265 |
424 |
2 |
N/A |
| Seed treatments |
13,575 |
4,993 |
88 |
Pencycuron (7,097) |
N/A = not applicable
Figure 49 Use of pesticides on ware potatoes (percentage of total area treated with formulations) - 2016
Note: insecticides include nematicides
Figure 50 Timing of pesticide applications on ware potatoes - 2016
Note: insecticides include nematicides
Figure 51 Reasons for use of herbicides on ware potatoes (where specified)
Legumes
The legumes category includes dry harvest peas and field beans. These crops have been combined as too few holdings were encountered to report the pesticide use for each crop separately
- An estimated 3,777 hectares of legumes were grown in Scotland in 2016, representing a 12 per cent increase from 2014
- 89 per cent of the legume crop was treated with a pesticide
- Pesticides were applied to 15,936 treated hectares
- 9,790 kilograms of pesticide were applied in total
- 51 per cent of pesticides applied were herbicides, 38 per cent fungicides, six per cent insecticides, three per cent molluscicides and one per cent sulphur and seed treatments ( Figure 52)
- No growth regulators were applied to the legume crops
- Legumes received on average 3.3 pesticide sprays (Table 1). These sprays included 1.6 fungicide applications and 1.8 herbicide applications (applied to 85 per cent and 84 per cent of the crop area respectively), 1.3 insecticide applications (applied to 20 per cent) and one molluscicide application (applied to 12 per cent)
- In relation to timings of pesticide applications, all molluscicides were applied in October and 33 per cent of herbicides were applied in March ( Figure 53). Fungicides were applied from May to July and insecticides were applied in June and July
- Where reasons were given, 44 per cent of fungicide use was for chocolate spot and 41 per cent was for general disease control ( Figure 54)
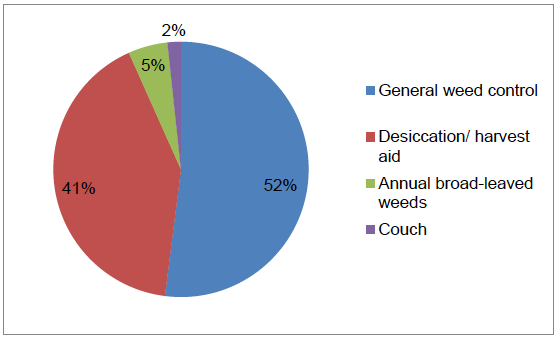
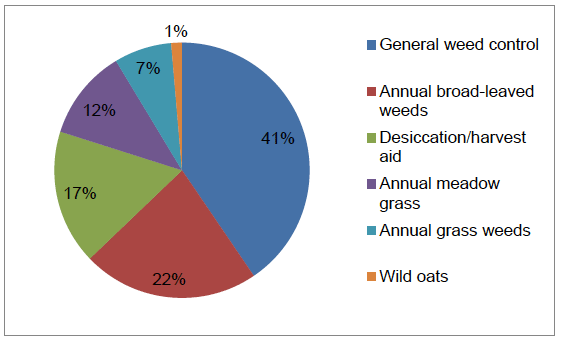
- 41 per cent of herbicide use was for general weed control and 22 per cent was for annual broad-leaved weeds ( Figure 55)
- 72 per cent of insecticide use was for general pests and 28 per cent was for weevils
- The most common variety encountered was Fuego, accounting for 42 per cent of the sample area
Summary of pesticide use on legumes:
| Pesticide group |
Formulation area treated (ha) |
Weight of pesticides applied (kg) |
% of crop area treated |
Most used formulations (ha) |
|---|---|---|---|---|
| Fungicides |
6,042 |
2,525 |
85 |
Chlorothalonil/cyproconazole (3,503) |
| Herbicides |
8,053 |
6,107 |
84 |
Glyphosate (1,908) |
| Insecticides |
989 |
10 |
20 |
Lambda-cyhalothrin (472), Zeta-cypermethrin (439) |
| Molluscicides |
458 |
55 |
12 |
Metaldehyde (458) |
| Sulphur |
230 |
1,068 |
6 |
N/A |
| Seed treatments |
164 |
25 |
4 |
Thiram (164) |
N/A = not applicable
Figure 52 Use of pesticides on legumes (percentage of total area treated with formulations) - 2016
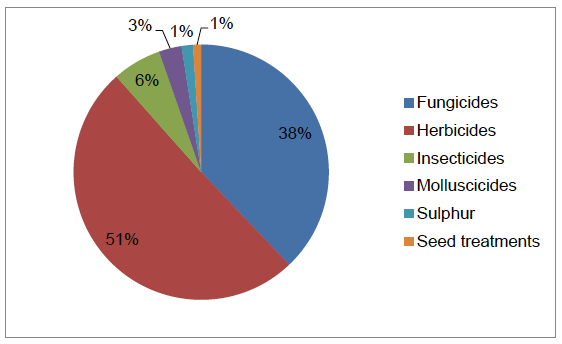
Figure 53 Timing of pesticide applications on legumes - 2016
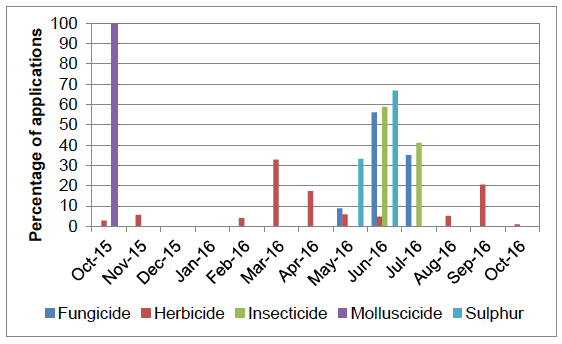
Figure 54 Reasons for use of fungicides on legumes (where specified)
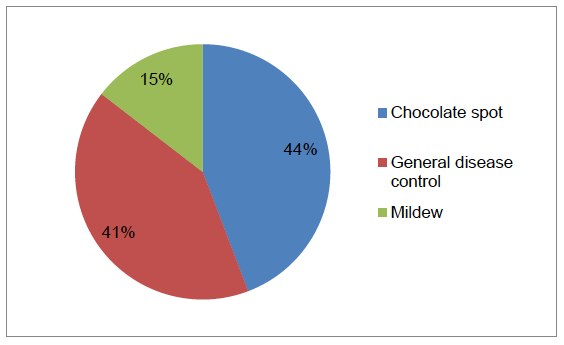
Figure 55 Reasons for use of herbicides on legumes (where specified)
Contact
There is a problem
Thanks for your feedback