Scotland's Marine Economic Statistics 2019
Statistics on the economic contributions of Scotland’s marine sectors in 2019. Includes a time series of Gross Value Added (GVA), turnover and employment for marine sectors. The supporting documents include: accessible tables, a summary topic sheet and a pdf version of the publication.
This document is part of a collection
2. Marine Economy Overview
2.1 Marine economic key points
In 2019, the Scottish marine economy generated £5 billion in GVA: accounting for 3.4% of the overall Scottish economy. The Scottish marine economy provided employment for 75,490 people (headcount), contributing 2.8% of the total Scottish employment.
The oil and gas services sector is the biggest contributor to the marine economy in terms of turnover and GVA. However, marine tourism employs the most people of all the sectors covered in this report. Oil and gas services provide 38.6% of the marine economy GVA and 20.8% of the employment while marine tourism provides 11.9% of the GVA and 43.8% of the employment (see Table 1).
There are considerable variations in labour productivity (GVA per worker) across the marine economy, with freight water transport having the highest GVA per worker in 2019 (around £572,000), and marine tourism producing the lowest at around £18,000.
Oil and gas extraction is not included in these figures, although support services for oil and gas are included. This broadly aligns the figures with those provided by the onshore values in the National Accounts for Scotland. See Annex B section 18.7 for more information.
| Description | GVA (millions of pounds) | Turnover (millions of pounds) | Employment headcount (thousands) | GVA per head (pounds) |
|---|---|---|---|---|
| Fishing | 329 | 596 | 4.9 | 67,257 |
| Aquaculture | 560 | 1,111 | 2.4 | 232,842 |
| Support for oil & gas | 1,945 | 4,527 | 15.7 | 123,885 |
| Processing | 390 | 1,707 | 6.8 | 57,368 |
| Shipbuilding | 408 | 1,094 | 6.3 | 64,825 |
| Construction & water transport services | 436 | 725 | 4.3 | 101,302 |
| Passenger water transport | 133 | 284 | 1.4 | 95,071 |
| Freight water transport | 229 | 385 | 0.4 | 572,250 |
| Renting & leasing of water transport equipment | 15 | 27 | 0.2 | 73,000 |
| Marine tourism | 598 | 1,111 | 33.1 | 18,076 |
| Total | 5,043 | 11,567 | 75.5 | 66,800 |
2.2 Marine economy trends
Between 2018 and 2019, the marine economy’s GVA increased by 12% from £4.5 billion to £5 billion (2019 prices). Employment increased by 0.4%.
| Year | GVA (millions of pounds) | Turnover (millions of pounds) | Employment headcount (thousands) |
|---|---|---|---|
| 2010 | 5,414 | 13,207 | 68.5 |
| 2011 | 4,914 | 13,162 | 69.9 |
| 2012 | 5,250 | 13,584 | 69.5 |
| 2013 | 5,283 | 14,148 | 74.0 |
| 2014 | 5,328 | 14,889 | 75.0 |
| 2015 | 5,113 | 14,418 | 79.1 |
| 2016 | 4,624 | 11,278 | 76.0 |
| 2017 | 5,413 | 12,154 | 74.5 |
| 2018 | 4,500 | 11,282 | 75.2 |
| 2019 | 5,043 | 11,567 | 75.5 |
SABS categories for oil and gas services changed in 2011 see Annex B section 18.7.
The longer term trend shows that between 2010 and 2019 the marine economy GVA (adjusted to 2019 prices) fell by 7% while employment increased by 10%.

The change in GVA from 2018 to 2019 is shown in Figure 2. The figures for the marine economy by industry are shown in Table 20 on page 50.

2.3 Marine economy by geography
The values presented at local authority level are mostly based on SABS data. Most values can be provided by local authority, though some become disclosive at this level and are aggregated into the ‘unallocated’ category. The methodology for combining values from the different sources is detailed in Annex B: Methodology and source data.
Aberdeen City accounted for £1.9 billion (37%) of the marine economy’s GVA for 2019, with Aberdeenshire the next highest with £884 million (18%) (Table 3). Highland contributed 6% of the marine GVA and 13% of the employment.
The biggest change in GVA (value not percentage) from 2018 to 2019 was in the Aberdeen City local authority (Table 23). This is due to changes in oil prices causing an increase in turnover for the for oil and gas support services. The second biggest change was in Fife local authority and is likely due to shipbuilding. This is discussed in more detail in the shipbuilding chapter.
| Local authority | GVA (millions of pounds) | Turnover (millions of pounds) | Employment headcount (thousands) | GVA (percentage of Scotland total) | Turnover (percentage of Scotland total) | Employment headcount (percentage of Scotland total) |
|---|---|---|---|---|---|---|
| Aberdeen City | 1,888 | 4,159 | 15.2 | 37% | 36% | 20% |
| Aberdeenshire | 884 | 2,104 | 8.9 | 18% | 18% | 12% |
| Angus | 45 | 93 | 1.1 | 1% | 1% | 1% |
| Argyll & Bute | 154 | 363 | 5.9 | 3% | 3% | 8% |
| City Of Edinburgh | 50 | 135 | 1.5 | 1% | 1% | 2% |
| Clackmannanshire | 1 | 3 | c | 0% | 0% | c |
| Dumfries & Galloway | 59 | 148 | 2.3 | 1% | 1% | 3% |
| Dundee City | 21 | 33 | 0.6 | 0% | 0% | 1% |
| East Ayrshire | 1 | 2 | c | 0% | 0% | c |
| East Dunbartonshire | c | c | c | c | c | c |
| East Lothian | 32 | 67 | 1.5 | 1% | 1% | 2% |
| East Renfrewshire | c | c | c | c | c | c |
| Falkirk | c | c | 0.7 | c | c | 1% |
| Fife | 146 | 367 | 5 | 3% | 3% | 7% |
| Glasgow City | 198 | c | 4.1 | 4% | c | 5% |
| Highland | 291 | 672 | 10 | 6% | 6% | 13% |
| Inverclyde | 87 | 150 | 1.6 | 2% | 1% | 2% |
| Midlothian | c | c | c | c | c | c |
| Moray | 29 | 78 | 1.1 | 1% | 1% | 1% |
| Na H-Eileanan Siar | 48 | 144 | 1.8 | 1% | 1% | 2% |
| North Ayrshire | 47 | 101 | 1.6 | 1% | 1% | 2% |
| North Lanarkshire | 7 | 21 | 0.2 | 0% | 0% | 0% |
| Orkney Islands | 43 | 89 | 1.4 | 1% | 1% | 2% |
| Perth & Kinross | 7 | 23 | 0.5 | 0% | 0% | 1% |
| Renfrewshire | 39 | 69 | 1.5 | 1% | 1% | 2% |
| Scottish Borders | 32 | 5 | 1.2 | 1% | 0% | 2% |
| Shetland Islands | 139 | 294 | 2 | 3% | 3% | 3% |
| South Ayrshire | 36 | 58 | 1.2 | 1% | 1% | 2% |
| South Lanarkshire | -1 | c | c | 0% | c | c |
| Stirling | 15 | 26 | 0.7 | 0% | 0% | 1% |
| West Dunbartonshire | 23 | 31 | 0.5 | 0% | 0% | 1% |
| West Lothian | 4 | 10 | 0.1 | 0% | 0% | 0% |
| Unallocated | 720 | 2,323 | 3.3 | 14% | 20% | 4% |
| Scotland | 5,043 | 11,567 | 75.5 | 100% | 100% | 100% |
The letter ‘c’ denotes disclosive data.
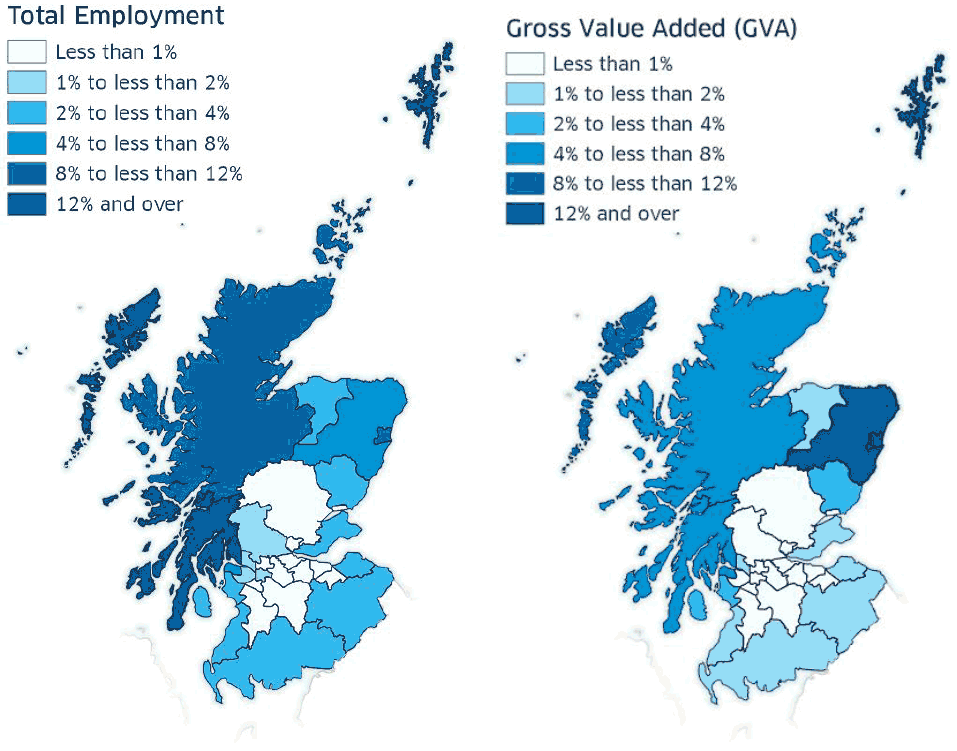
GVA and employment in the marine sector is particularly important to rural economies. Figure 3 shows the proportion that the marine sector contributes to each local authority’s GVA and employment. The marine sector contributes most to the Shetland Islands, accounting for 19% of the total GVA in Shetland and 17% of employment in 2019.
Scottish Government (Marine Scotland) 2022. © Crown copyright and database right
Contact
There is a problem
Thanks for your feedback