The Scottish Health Survey 2022: summary report
Key findings from the Scottish Health Survey 2022 report.
This document is part of a collection
Chapter 8. Diet and Obesity
The proportion of children aged 2-15 eating five or more portions of fruit and vegetables a day was higher in 2021 and 2022 than in the rest of the time series, the mean number of portions of fruit and vegetables consumed per day followed the same pattern.
The proportion of children that did not consume any fruit or vegetables increased with age
- Aged 2-4: 4%
- Aged 5-7: 4%
- Aged 8-10: 10%
- Aged 11-12: 11%
- Aged 13-15: 14%
In 2021/2022 there continued to be a decline in the proportion of children consuming tuna fish once a week or more, whilst the proportion of children consuming oily fish or white fish once a week or more increased.
- Tuna fish
- 2008/2009: 32%
- 2021/2022: 22%
- Oily fish
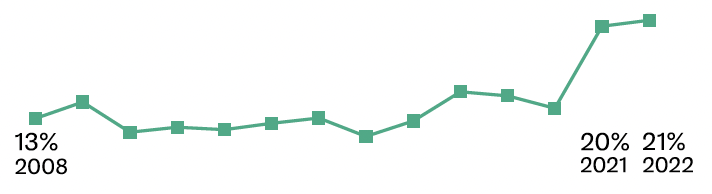
- 2008/2009: 13%
- 2021/2022: 19%
- White fish
- 2008/2009: 48%
- 2021/2022: 52%
Children’s consumption of red meat at least twice a week has declined over time.
- 2008/2009: 57%
- 2021/2022: 51%
Children’s consumption of skimmed or semi- skimmed milk has declined over time.
- 2008/2009: 57%
- 2021/2022: 52%
The linear decline in consumption of biscuits once a day or more continued in 2021/2022.
- 2008/2009: 42%
- 2021/2022: 24%
The greatest change over the time series has occurred in consumption of non-diet soft drinks once a day or more, from 38% in 2008/2009 to 16% in 2017/2018, and to 5% in 2021/2022.
- 2008/2009: 38%
- 2017/2018: 16%
- 2021/2022: 5%
Children’s consumption of at least 2-3 slices of high fibre bread a day has declined over time.
- 2008/2009: 35%
- 2021/2022: 24%
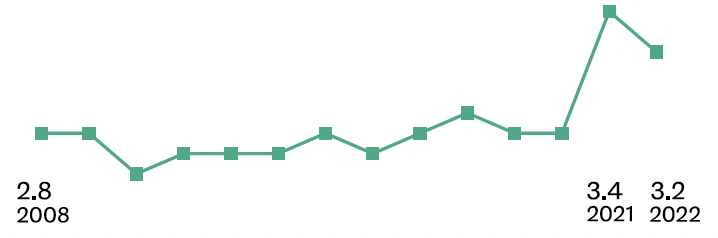
In 2022, the Body Mass Index (BMI) for adults was 28.0, the same as in 2021, and an increase from 27.1kgm-2 in 2003.
- 2003: 27.1
- 2021: 28.0
- 2022: 28.0
In 2022, 32% of all adults had a BMI between 18.5 and 25 kgm-2 - classed in the healthy weight category.
- BMI of 18.5 to less than 25 kgm-2 32%: 32%
Around two-thirds of all adults (67%) were living with overweight (including obesity) in 2022, with a higher prevalence in men than women.
- Men: 70%
- Women: 63%
Those aged 16-24 had a significantly lower prevalence of living with overweight (including obesity) compared with older age groups.
- 16-24: 39%
- 25-34: 59%
- 35-44: 66%
- 45-54: 75%
- 55-64: 75%
- 65-74: 77%
- 75+: 70%
The proportions of adults in the healthy weight category decreased as area deprivation increased, from 39% in the least deprived areas to 28% in the most deprived areas.
- Least deprived: 39%
- 4th: 32%
- 3rd: 30%
- 2nd: 28%
- Most deprived: 28%
Mean adult BMI varied significantly by area deprivation in 2022, increasing from 26.7kgm-2 in the least deprived areas to 29.0 kgm-2 in the most deprived areas.
- Least deprived: 26.7%
- 4th: 27.8%
- 3rd: 28.1%
- 2nd: 28.7%
- Most deprived: 29.0%
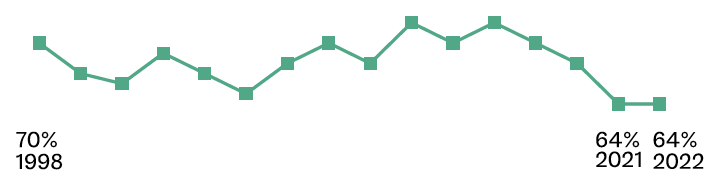
In 2022, 64% of children were in the healthy weight category. This was at the same level as in 2021, which was the lowest since the start of the time series in 1998.
One third of children were at risk of overweight (including obesity). This was 5 percentage points higher than in 2021, and the highest level since 2011.
- 2011: 33%
- 2021: 28%
- 2022: 33%
Contact
There is a problem
Thanks for your feedback