The Scottish Health Survey 2022 – volume 2: technical report
This publication presents information on the methodology and fieldwork from the Scottish Health Survey 2022.
This document is part of a collection
Chapter 2 Methods and Definitions
Victoria Wilson
2.1. General survey definitions
Age standardisation
Age standardisation has been used in some analysis in order to enable groups to be compared after adjusting for the effects of any differences in their age distributions.
When different sub-groups are compared in respect of a variable on which age has an important influence, any differences in age distributions between these sub-groups are likely to affect the observed differences in the proportions of interest.
Age standardisation was carried out, using the direct standardisation method. The standard population to which the age distribution of sub-groups was adjusted was the mid-2021 population estimates for Scotland. All age standardisation has been undertaken separately within each sex.
The age-standardised proportion was calculated as follows, where is the age specific proportion in age group i and is the standard population size in age group i:
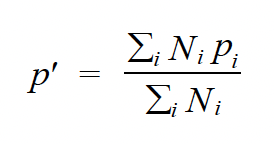
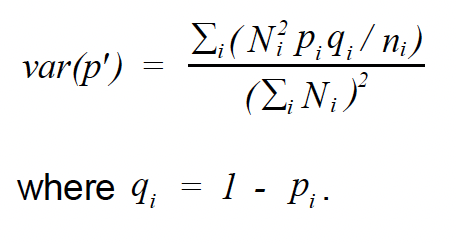
Therefore can be viewed as a weighted mean of using the weights . Age standardisation was carried out using the age groups: 16-24, 25-34, 35-44, 45-54, 55-64, 65-74 and 75 and over. The variance of the standardised proportion can be estimated by:
Household
A household was defined as one person or a group of people who have the accommodation as their only or main residence and who either share at least one meal a day or share the living accommodation.
Household Reference Person (HRP)
The HRP is defined as the householder (a person in whose name the property is owned or rented) with the highest income. If there is more than one householder and they have equal income, then the household reference person is the oldest.
Mean
All means in this report are Arithmetic means (the sum of the values for cases divided by the number of cases).
Median
The value of a distribution which divides it into two equal parts such that half the cases have values below the median and half the cases have values above the median.
NHS Health Board
The National Health Service (NHS) in Scotland is divided up into 14 geographically based local NHS Boards and a number of National Special Health Boards. Health Boards in this report refers to the 14 local NHS Boards.
Percentile
The value of a distribution which partitions the cases into groups of a specified size. For example, the 20th percentile is the value of the distribution where 20 percent of the cases have values below the 20th percentile and 80 percent have values above it. The 50th percentile is the median.
P-value
A p value is the probability of the observed result occurring due to chance alone. A p value of less than 5% is conventionally taken to indicate a statistically significant result (p<0.05). It should be noted that the p value is dependent on the sample size, so that with large samples differences or associations which are very small may still be statistically significant. Results should therefore be assessed on the magnitude of the differences or associations as well as on the p value itself. The p values given in this report take into account the clustered sampling design of the survey.
Quintile
Quintiles are percentiles which divide a distribution into fifths, i.e., the 20th, 40th, 60th and 80th percentiles.
Scottish Index of Multiple Deprivation (SIMD)
The SIMD is the Scottish Government's official measure of area based multiple deprivation. It is based on 37 indicators across 7 individual domains of current income, employment, housing, health, education, skills and training and geographic access to services and telecommunications. SIMD is calculated at data zone level, enabling small pockets of deprivation to be identified. The data zones are ranked from most deprived (1) to least deprived (6505) on the overall SIMD index. The result is a comprehensive picture of relative area deprivation across Scotland.
This report uses the SIMD 2020 for the 2019, 2021 and 2022 data (see Scottish Index of Multiple Deprivation 2020).
Significance testing
Where differences in relation to a particular outcome between two subgroups, such as men and women, are highlighted in the main report, the differences can be considered statistically significant, unless otherwise stated.
Statistical significance is calculated using logistic regression to provide a p-value based on a two-tailed significance test. One-tailed tests are used when the difference can only be in one direction. Two-tailed tests should always be used when the difference can theoretically be in either direction. For example, even though previous research has shown a higher prevalence of hazardous levels of alcohol consumption among men than among women, and we may expect this to be true in the most recent survey, a two-tailed test is used to confirm the difference.
Standard deviation
The standard deviation is a measure of the extent to which the values within a set of data are dispersed from, or close to, the mean value. In a normally distributed set of data 68% of the cases will lie within one standard deviation of the mean, 95% within two standard deviations and 99% will be within 3 standard deviations. For example, for a mean value of 50 with a standard deviation of 5, 95% of values will lie within the range 40-60.
Standard error (of the mean)
The standard error is a variance estimate that measures the amount of uncertainty (as a result of sampling error) associated with a survey statistic. All data presented in this report in the form of means are presented with their associated standard errors (with the exception of the WEMWBS scores which are also presented with their standard deviations). Confidence intervals are calculated from the standard error; therefore, the larger the standard error, the wider the confidence interval will be.
Unweighted bases
The unweighted bases presented in the report tables provide the number of individuals upon which the data in the table is based. This is the number of people that were interviewed as part of SHeS and provided a valid answer to the particular question or set of questions. The unweighted bases show the number of people interviewed in various subgroups including sex, age and Scottish Index of Multiple Deprivation.
Weighted bases
The weighted bases are adjusted versions of the unweighted bases which involves calculating a weight for each individual so that their representation in the sample reflects their representation in the general population of Scotland living in private households. Categories within the table can be combined by using the weighted bases to calculate weighted averages of the relevant categories.
2.2. Chapter definitions
2.2.1 Chapter 1 – Mental wellbeing
Warwick-Edinburgh Mental Wellbeing Scale (WEMWBS)
The WEMWBS was developed by researchers at the Universities of Warwick and Edinburgh, with funding provided by NHS Health Scotland, to enable the measurement of mental wellbeing of adults in the UK. It was adapted from a 40 item scale originally developed in New Zealand, the Affectometer 2. The WEMWBS scale comprises 14 positively worded statements with a five item scale ranging from '1 - None of the time' to '5 - All of the time'. The lowest score possible is therefore 14 and the highest is 70; the tables present mean scores. The 14 items are designed to assess positive affect (optimism, cheerfulness, relaxation); and satisfying interpersonal relationships and positive functioning (energy, clear thinking, self-acceptance, personal development, mastery and autonomy)[13].
The scale was not designed to identify individuals with exceptionally high or low levels of positive mental health, so cut-off points have not been developed[14].
WEMWBS is used to monitor the National Indicator 'mental wellbeing'[15] for adults.
General Health Questionnaire (GHQ-12)
GHQ-12[16] is a scale designed to detect possible psychiatric morbidity in the general population. GHQ-12is a widely used standard measure of mental distress and mental ill-health consisting of 12 questions on concentration abilities, sleeping patterns, self-esteem, stress, despair, depression, and confidence in the previous few weeks. Responses to each of the GHQ-12 items are scored, with one point allocated each time a particular feeling or type of behaviour is reported to have been experienced 'more than usual' or 'much more than usual' over the previous few weeks.
These scores are combined to create an overall score of between zero and twelve. A score of four or more (referred to as a high GHQ-12 score) has been used here to indicate the presence of a possible psychiatric disorder. A score of zero on the GHQ-12 questionnaire can, in contrast, be considered to be an indicator of psychological wellbeing. GHQ-12 measures deviations from people's usual functioning in the previous few weeks and therefore cannot be used to detect chronic conditions.
Revised clinical interview schedule (CIS-R)
Depression and anxiety
Details on symptoms of depression and anxiety are collected via a standardised instrument, the CIS-R[17]. The CIS-R is a well-established tool for measuring the prevalence of mental disorders. The complete CIS-R comprises 14 sections, each covering a type of mental health symptom and asks about presence of symptoms in the week preceding the interview. Prevalence of two of these mental illnesses - depression and anxiety - were introduced to the Scottish Health Survey in 2008. Given the potentially sensitive nature of these topics, they were included in the nurse interview part of the survey prior to 2012[18]. Since 2012 the questions have been included in the biological module where they form part of the self-completion questionnaires. The change in mode of data collection may have impacted response, and comparisons of 2016/2017 figures and onwards with pre-2012 figures should be interpreted with caution. There is a possibility that any observed changes in prevalence across this period may simply reflect the change in mode rather than any real change in the population.
Questions on depression cover a range of symptoms, including feelings of being sad, miserable, or depressed, and taking less of an interest and getting less enjoyment out of things than usual. Questions on anxiety cover feelings of anxiety, nervousness, and tension, as well as phobias, and the symptoms associated with these.
Suicide attempts and self-harm
In addition to being asked about symptoms of depression and anxiety, participants were also asked whether they had ever attempted to take their own life. The question was worded as follows:
Have you ever made an attempt to take your own life, by taking an overdose of tablets or in some other way?
Those who said yes were asked if this was in 'the last week, in the last year or at some other time?' Note that this question is likely to underestimate the prevalence of very recent attempts, as people might be less likely to agree to take part in a survey immediately after a traumatic life event such as this. Furthermore, suicide attempts will only be captured in a survey among people who do not succeed at their attempt.
Since 2008, participants have also been asked whether they have ever self-harmed in any way but not with the intention of killing themselves. Those who said that they had self-harmed were also asked if this was 'in the last week, last year or at some other time'. The percentage of adults who have self-harmed in the last year is one of the national mental health indicators for adults[19].
Since 2012 these questions have been included in the self-completion parts of the biological module. Prior to 2012 they were administered in the nurse interview, and any changes over time need to be interpreted with caution due to the change in mode.
Loneliness
A question was included in the adult and young adult self-completion questionnaires to measure levels of loneliness experienced in the week prior to being interviewed, with five answer options ranging from 'none or almost none of the time' to 'all or almost all of the time'. This differs from the question used prior to 2021 where the period asked about was two weeks.
2.2.2 Chapter 2 – General health, cardiovascular disease and caring
General health
Long-term conditions & limiting long-term conditions
Long-term conditions were defined as a physical or mental health condition or illness lasting or expected to last 12 months or more. The wording of this question changed in 2012 and is now aligned with the harmonised questions for all large Scottish Government surveys. Long-term conditions were coded into categories defined in the International Classification of Diseases (ICD), but it should be noted that the ICD is used mostly to classify conditions according to the cause, whereas SHeS classifies according to the reported symptoms. A long-term condition was defined as limiting if the respondent reported that it limited their activities in any way.
Self-assessed general health
Each year, participants who are aged 13 and over are asked to rate their health in general with answer options ranging from 'very good' to 'very bad'. For children under the age of 13 the question is answered by the parent or guardian completing the interview on their behalf.
Cardiovascular conditions
Blood pressure/hypertension
Participants were defined as having self-reported doctor-diagnosed hypertension if they stated during the interview that they had been told by a doctor or nurse that they had high blood pressure.
Cardiovascular disease (CVD)
Participants were asked whether they had ever suffered from any of the following conditions: diabetes, angina, heart attack, stroke, heart murmur, irregular heart rhythm, or 'other heart trouble'. If they responded affirmatively to any of these conditions, participants were asked whether they had ever been told they had the condition by a doctor and whether they had experienced the conditions in the previous 12 months. For the purpose of this report, participants were classified as having a particular condition only if they reported that the diagnosis was confirmed by a doctor.
It is important to note that no attempt was made to verify these self-reported diagnoses objectively. It is, therefore, possible that some misclassification may have occurred because some participants may not have remembered (or not remembered correctly, or not known about) diagnoses made by their doctor.
Any CVD condition
Participants were classified as having 'any CVD' if they reported ever having any of the following conditions confirmed by a doctor: angina, heart attack, stroke, heart murmur, abnormal heart rhythm, or 'other heart trouble'[20].
Diabetes
Participants were classified as having diabetes if they reported a confirmed doctor diagnosis. Women whose diabetes occurred only during pregnancy were excluded from the classification. In 2018, a new question was introduced asking participants to report if they had been told they had Type 1 or Type 2 diabetes. Prior to 2018 no distinction was made between Type 1 and Type 2 diabetes in the interview.
Any CVD condition or diabetes
A summary measure of the above conditions is presented in the tables as 'any CVD condition or diabetes'.
Ischaemic heart disease (IHD)
IHD is also known as coronary heart disease. Participants were classified as having IHD if they reported ever having angina, a heart attack or heart failure diagnosed by a doctor.
Stroke
Participants were classified as having a stroke if they reported ever having had a stroke confirmed by a doctor.
IHD or Stroke
A summary measure of the above conditions is presented in the tables as 'IHD or stroke'.
2.2.3 Chapter 3 – Respiratory
Asthma and Respiratory Symptoms
Participants (including parents of children aged 0-12, and children themselves aged 13-15) were asked if a doctor had ever told them they had asthma. This question was asked in the 1998, 2003, 2008 and 2010 surveys, and has been included every year since 2012. No objective measures were used to confirm these reported diagnoses.
Questions on respiratory symptoms were included in the 1995-2003 surveys, and in all even years since 2008. The symptoms covered were: phlegm production, breathlessness and wheezing or whistling in the chest. Breathlessness was classified as grade 2 if it occurred when hurrying on level ground or walking up a slight hill, or grade 3 (the more severe form) if it occurred when walking with other people of the same age on level ground. The impact of wheezing and whistling symptoms on sleep and people's daily activities was also measured. The Medical Research Council Respiratory Symptom Questionnaire was used to collect some of this information[21].
Chronic Obstructive Pulmonary Disease (COPD)
COPD is defined by the World Health Organisation as 'a pulmonary disease characterised by chronic obstruction lung airflow that interferes with normal breathing and is not fully reversible'. It is associated with symptoms and clinical signs that in the past have been called 'chronic bronchitis' and 'emphysema,' including regular cough (at least three consecutive months of the year) and production of phlegm.
Each year since 2008, adult participants have been asked if they had ever had COPD, chronic bronchitis or emphysema and, if so, whether a doctor had told them they had one of these conditions. Those who reported doctor-diagnosed COPD were also asked what treatment or advice they had received. No objective measures were used to confirm these reported diagnoses.
Long COVID
Questions asked whether participants had or thought they had COVID-19 and how long their symptoms lasted. Long COVID was defined by experiencing symptoms more than 4 weeks after they first had COVID-19 that were not explained by something else.
It should be noted that due to changes in the question wording, the long-COVID data is not equivalent with that calculated and reported in the 2021 report.
2.2.4 Chapter 5 – Chronic Pain
Chronic pain has been broadly defined as persistent pain that continues for longer than 12 weeks despite medication or treatment and can affect all ages and different parts of the body[22]. The SHeS 2022 survey collected information for the first time for both adults and children on the prevalence and impact on the lives of individuals living with chronic pain in Scotland, as well as access to support.
Within the SHeS 2022 main report, data is presented on the prevalence of chronic pain among both adults and children in Scotland, the types of chronic pain experienced/lived with, whether this limits life/work activities, support, and analysis of the impact on mental wellbeing using the WEMWBS scale among adults.
2.2.5 Chapter 6 – Alcohol
UK Chief Medical Officers' Alcohol Guidelines
The UK CMO alcohol guidelines consist of three recommendations:
- a weekly guideline on regular drinking;
- advice on single episodes of drinking; and
- a guideline on pregnancy and drinking
According to the weekly guideline, adults are safest not to regularly drink more than 14 units per week, to keep health risks from drinking alcohol to a low level. If you do drink as much as 14 units a week, it is best to spread this evenly over three days or more. On a single episode of drinking, advice is to limit the total amount drunk on any occasion, drink more slowly, drink with food and alternate with water. The guideline on drinking and pregnancy, or planning a pregnancy, advises that the safest approach is not to drink alcohol at all[23].
Questions on alcohol
Questions about drinking alcohol have been included in SHeS since its inception in 1995. Questions are asked either face-to-face via the interviewer or included in the self-completion questionnaire if they are deemed too sensitive for a face-to-face interview (e.g. if being interviewed with a parent). All those aged 16-17 years are asked about their consumption via the self-completion, as are some of those aged 18-19 years, at the interviewers' discretion. The way in which alcohol consumption is estimated in the survey was changed significantly in 2008. A detailed discussion of those revisions can be found in the chapter on alcohol consumption in the 2008 report[24].
In 2022, the SHeS questionnaire covered the usual weekly consumption of alcohol.
Weekly consumption
Participants (aged 16 years and over) were asked preliminary questions to determine whether they drank alcohol at all. For those who reported that they drank, these were followed by further questions on how often during the past 12 months they had drunk each of six different types of alcoholic drink:
- normal strength beer, lager, stout, cider, and shandy
- strong beer, lager, stout, and cider
- spirits and liqueurs
- sherry and martini
- wine
- alcoholic soft drinks (alcopops)
From these questions, the average number of days per week the participant had drunk each type of drink was estimated. A follow-up question asked how much of each drink type they had usually drunk on each occasion. These data were converted into units of alcohol and multiplied by the amount they said they usually drank on any one day[25].
Calculating alcohol consumption
The guidelines on lower risk drinking are expressed in terms of units of alcohol consumed. Detailed information on both the volume of alcohol drunk in a typical week and on the heaviest drinking day in the week preceding the survey was collected from participants. The volumes reported were not validated. In the UK, a standard unit of alcohol is 10 millilitres or around 8 grams of ethanol (pure alcohol). In this chapter, alcohol consumption is reported in terms of units of alcohol.
Questions on the quantity of wine drunk were revised in 2008. Since then, participants reporting drinking any wine have been asked what size of glass they drank from: large (250ml), medium (175ml) and small (125ml). In addition, to help participants make more accurate judgements they are also shown a showcard depicting glasses with 125ml, 175ml and 250ml of liquid. Participants also had the option of specifying the quantity of wine drunk in bottles or fractions of a bottle; with a bottle treated as the equivalent of six small (125ml) glasses.
There are numerous challenges associated with calculating units at a population level, not least of which are the variability of alcohol strengths and the fact that these have changed over time. The table below outlines how the volumes of alcohol reported in the survey were converted into units (the 2008 report provides full information about how this process has changed over time)[26].Those who drank bottled or canned beer, lager, stout or cider were asked in detail about what they drank, and this information was used to estimate the amount in pints.
| Type of drink | Volume reported | Unit conversion factor |
|---|---|---|
| Normal strength beer, lager, stout, cider, shandy (less than 6% Alcohol By Volume (ABV) | Half pint | 1.0 |
| Can or bottle | Amount in pints multiplied by 2.5 | |
| Small can (size unknown) |
1.5 | |
| Large can / bottle (size unknown) |
2.0 | |
| Strong beer, lager, stout, cider, shandy (6% ABV or more) | Half pint | 2.0 |
| Can or bottle | Amount in pints multiplied by 4 | |
| Small can (size unknown) |
2.0 | |
| Large can / bottle (size unknown) |
3.0 | |
| Wine (including champagne and prosecco) | 250ml glass | 3.0 |
| 175ml glass | 2.0 | |
| 125ml glass | 1.5 | |
| 750ml bottle | 1.5 x 6 | |
| Sherry, vermouth and other fortified wines | Glass | 1.0 |
| Spirits | Glass (single measure) | 1.0 |
| Alcopops | Small can or bottle | 1.5 |
| Large (700ml) bottle | 3.5 |
2.2.6 Chapter 7 – Smoking
Questions on smoking behaviour
Questions on smoking have been included in SHeS since 1995. Some small changes were made to the questions in 2008 and 2012. These are outlined in the relevant annual reports[27],[28].
The current questions in the survey focus on:
- current smoking status
- frequency and pattern of current smoking
- the number of cigarettes smoked by current smokers
- exposure to second-hand smoke
- past smoking behaviour, current and ex-smokers
- quit attempts and desire to give up smoking
- medical advice on giving up smoking
- nicotine replacement therapy (NRT) use (including questions on NRT that led to successful cessation)
- Nicotine Vapour Products (NPVs) e.g. e-cigarettes/vapes (including as part of a quit attempt)
Adults aged 20 and over were asked about their smoking behaviour during the telephone interview. For those aged 16 and 17, information was collected in a self-completion questionnaire offering more privacy and reducing the likelihood of concealing behaviour in front of other household members. Those aged 18 and 19 could answer the questions either during the interview or via the self-completion, at the interviewer's discretion.
The self-completion questions were largely similar to those asked in the interview. However, given the age of the participants completing the self-completion questionnaire, questions on past smoking behaviour, desire to give up smoking and medical advice to stop smoking were excluded.
Smoking status
Smoking status categories reported here are:
- current cigarette smoker
- ex-regular cigarette smoker
- never regular cigarette smoker
- never smoked cigarettes at all
Information on cigar and pipe use is collected in the survey but as prevalence is low these are not considered in the definition of current smoking.
Dual use of cigarettes and e-cigarettes/vaping is also reported in 2022 using the following categories:
- currently vape and currently smoke cigarettes
- currently vape and used to smoke cigarettes (regularly/occasionally)
- currently vape and never smoked cigarettes
- currently smoke and do not currently vape
- do not currently vape or smoke
Nicotine Vapour Products (Electronic/e-cigarettes/vapes)
Electronic cigarettes or e-cigarettes are battery-powered handheld devices which heat a liquid that delivers a vapour. The vapour is then inhaled by the user, which is known as 'vaping'. E-cigarettes typically consist of a battery, an atomiser and a cartridge containing the liquid. Earlier models, often referred to as 'cigalikes', were designed to closely resemble cigarettes but there is now a wide variety of product types on the market. The liquid is usually flavoured and may not contain nicotine, although in most cases e-cigarettes are used with nicotine. Unlike conventional or traditional cigarettes, they do not contain tobacco and do not involve combustion (i.e. they are not lit).
SHeS has gathered information on the use of e-cigarettes among the Scottish adult population since 2014, in response to their increased availability and high profile. The questions ask whether participants have ever used an e-cigarette as well as whether they currently use an e-cigarette. The questions about e-cigarettes were amended in 2016 to include the term 'vaping devices'.
Exposure to second-hand smoke
In 2022 exposure to second-hand smoke in adults was measured by asking respondents to self-report where they have been exposed to second-hand smoke. The measurement of cotinine levels from saliva samples, routinely used previously on SHeS but dropped from the 2021 survey and the early part of the 2022 survey - where interviews were conducted by telephone - due to COVID-19 restrictions, were reintroduced in 2022 when the survey returned to in-home data collection.
Exposure to second-hand smoke for children is measured in two ways in the survey:
- whether there is someone who regularly smokes inside the accommodation where the child lives, and
- parents' and older children's (aged 13-15) reports of whether children are exposed to smoke at home.
Nicotine Replacement Therapy (NRT)
The remedial administration of nicotine to the body by means other than tobacco, usually as part of smoking cessation. Common forms of nicotine replacement therapy are nicotine patches and nicotine gum.
2.2.7 Chapter 8 – Diet and Obesity
Adult dietary data
Intake24, an online dietary tool, was introduced as a means of collecting and analysing data on adult dietary intakes for the 2021 survey. This replaced previous methods of obtaining adult dietary data that were used in SHeS and will be repeated every three years. Therefore, no adult dietary data is reported in 2022.
Fruit and vegetable consumption (children)
Data on fruit and vegetable consumption among children was measured using survey questions, as in previous years. It is recommended that children eat at least five portions of fruit and vegetables per day[29].
Body Mass Index (BMI)
BMI is a widely accepted measure that allows for differences in weight due to height. It is defined as weight (kg)/square of height (m2). This has been used as a measure of obesity in SHeS since its inception in 1995. BMI has some limitations and does not, for example, distinguish between mass due to body fat and mass due to muscular physique[30].
In 2022, data on heights and weights was obtained by two methods:
1. Standardised height and weight measurements administered by an interviewer in-home.
2. Participants estimating their height and weight
These self-reported and interviewer-administered measures have been used to calculate estimated BMI. So, while these estimates have been calculated, this data should be used with caution given the contribution of some self-reported data to these measures.
Work undertaken to analyse data from the Health Survey for England (HSE) and Active Lives Surveys found that, on average, participants overestimated their height and underestimated their weight[31]. Adjustments for adults have been made to account for this and while these corrections appear to remove some bias from the estimates, caution is advised in interpreting this data.
Based on their BMI (calculated from self-reported height and weight), adult participants were classified into the following groups based on the World Health Organisation (WHO) classification[32]:
| BMI (kg/m2) | Description |
|---|---|
| Less than 18.5 | Underweight |
| 18.5 to less than 25 | Normal |
| 25 to less than 30 | Overweight, excluding obesity |
| 30 to less than 40 | Obesity, excluding morbid obesity |
| 40+ | Morbid obesity |
The adult BMI data presented in the report and the data tables includes self-reported data that has been adjusted according to the formula from this HSE and Active Lives work referenced previously. A comparison of the unadjusted and adjusted weighted data for all adults interviewed as part of the survey is presented in the table below.
| BMI (kg/m2) | Unadjusted | Adjusted |
|---|---|---|
| Less than 18.5 | 2% | 1% |
| 18.5 to less than 25 | 36% | 28% |
| 25 to less than 30 | 37% | 39% |
| 30 to less than 40 | 22% | 28% |
| 40+ | 3% | 4% |
| Mean | 27.4 | 28.6 |
The child BMI data included in the report and data tables is based only on those with interviewer administered measurements. Based on their BMI, child participants were classified into the following groups based on the World Health Organisation (WHO) classification[33].
Although the BMI calculation method is the same, there are no fixed BMI cut-off points defining overweight and obesity in children. Instead, overweight and obesity are defined using several other methods including age and sex specific BMI cut-off points or BMI percentile cut-offs based on reference populations.
Children can be classified into the following groups:
| BMI (percentile) | Description |
|---|---|
| Above 2nd and below 85th | Within healthy range |
| At or above 2nd, at or above 85th | Outwith healthy range |
| At or above 85th, below 95th | At risk of overweight |
| At or above 95th | At risk of obesity |
Waist Circumference
Waist circumference is a measure of deposition of abdominal fat. It is measured during the biological module. A raised waist circumference has been defined as more than 102cm in men and more than 88cm in women. In 2022, it was possible to collect accurate information for waist circumference (WC) for a proportion of the version B sample interviews; therefore, some caution due to the reduced sample size for 2022 is advised.
2.2.8 Chapter 9 – Physical Activity
| Age group | Guidelines |
|---|---|
| Early years – children under 5 years | Infants (less than 1 year): Physical activity is recommended several times a day (the more activity the better) in a variety of ways including interactive floor-based activity, e.g. crawling. Where infants are not yet mobile, at least 30 minutes of tummy time spread across the day and while awake is recommended along with movements such as reaching and grasping, pushing and pulling themselves over independently, or rolling over; more is better. Toddlers (1-2 years): At least 180 minutes (3 hours) of physical activity of any intensity is recommended for toddlers, including active and outdoor play. Pre-schoolers (3-4 years): At least 180 minutes (3 hours) of activity is also recommended for pre-school aged children, including a variety of active and outdoor play physical activities spread throughout the day. For this age group, this should include at least 60 minutes of moderate-to-vigorous intensity physical activity. |
| Children and young people aged 5 to 18 | It is recommended that children and young people in this age group engage in moderate-to-vigorous intensity physical activity for an average of at least 60 minutes per day. The activities undertaken include those undertaken in a variety of settings such as school-based physical education, active travel, after school activities, play and sporting activities. Engagement in a range of activities and intensities over the course of a week is recommended in order to develop movement skills, muscular fitness and bone strength. This activity should be accompanied by as minimal an amount of sedentary time as possible, with any long periods of inactivity broken up with some physical activity, even if this is light in nature. |
| Adults aged 19-64 | Daily physical activity is recommended for both physical and mental health benefits - the more the better but any activity is encouraged. This includes activities to develop and strengthen the major muscle groups, which can be achieved through activities such as heavy gardening, carrying heavy shopping, or resistance exercise. It is recommended that muscle strengthening activities are done on at least two days a week, but any strengthening activity is better than none. On a weekly basis, adults should undertake:
|
| Adults aged 65 and over | Daily physical activity is also recommended for older adults for the maintenance of good physical and mental health, wellbeing, and social functioning. Even light activity offers greater health benefits than being sedentary, although the more daily physical activity that is undertaken, the better. Older adults should also undertake activities aimed at improving or maintaining muscle strength, balance and flexibility on at least two days a week, either on their own or combined with moderate aerobic activity. This should be accompanied by 150 minutes (two and a half hours) of moderate intensity aerobic activity, building gradually up to this where activity levels are currently lower. Those who are already regularly active can achieve these benefits through:
|
Adult physical activity questionnaire
The SHeS questionnaire[34] asks about four main types of physical activity:
- home-based activities (housework, gardening, building work and DIY)
- walking
- sports and exercise
- activity at work
Information is collected on the:
- time spent being active
- intensity of the activities undertaken
- frequency with which activities are performed.
Adherence to adult physical activity guidelines
The activity guidelines advised adults to accumulate 150 minutes of moderate activity or 75 minutes of vigorous activity per week or an equivalent combination of both, in bouts of 10 minutes or more. These guidelines are referred to as the Moderate or Vigorous Physical Activity guidelines (MVPA). To help assess adherence to this guideline, the intensity level of activities mentioned by participants was estimated.
Activities of low intensity, and activities of less than 10 minutes duration, were not included in the assessment. This allowed the calculation of a measure of whether each SHeS participant adhered to the guideline, referred to in the text and tables as "adult summary activity levels", see the table below. A more detailed discussion of this calculation is provided in the 2012 report[35].
Adult summary activity levelsa
| Meets MVPA guidelines | Reported 150 mins/week of moderate physical activity or 75 mins vigorous physical activity, or an equivalent combination of these. |
|---|---|
| Some activity | Reported 60-149 mins/week of moderate physical activity, or 30-74 mins/week vigorous physical activity, or an equivalent combination of these. |
| Low activity | Reported 30-59 mins/week of moderate physical activity, or 15-29 mins/week vigorous physical activity or an equivalent combination of these. |
| Very low activity | Reported less than 30 mins/week of moderate physical activity, or less than 15 mins/week vigorous physical activity, or an equivalent combination of these. |
a Only bouts of 10 minutes or more were included towards the 150 minutes per week guideline.
To avoid overcomplicating the text, where descriptions are provided of the summary activity levels, they tend to refer only to moderate physical activity, although the calculations were based on moderate or vigorous activity as described above.
Muscle strengthening
A second summary measure was calculated for adults, in respect of meeting the guidelines to carry out activities that strengthen muscles on at least 2 days a week to increase bone strength and muscular fitness.
Nine different sports were classed as always muscle strengthening, and other sports or exercises were classed as muscle strengthening if the participant reported that the effort was enough to make the muscles feel some tension, shake or feel warm. If the participant carried out such activities for at least 10 minutes on 2 or more days a week, on average, they were deemed to meet the muscle strengthening guideline. As this only includes muscle strengthening through sporting activity, reported levels may be an underestimate.
Child Physical Activity Questionnaire
The questions on child physical activity are slightly less detailed than those for adults[36]. No information on intensity is collected (with the exception of asking those aged 13-15 about their walking pace). The questions cover:
- sports and exercise
- active play including housework and gardening
- walking
Where appropriate, data are collected and reported for physical activity undertaken at and outside of school.
Sedentary time
Data are collected for adults and children on sedentary time on weekdays and weekends. Sedentary time is calculated from questions on time spent sitting at work, watching TV/another type of screen and/or time spent sitting doing other activities such as eating a meal, reading, napping etc.
2.3. A note about bases for men and women in the 2022 tables
In 2022, a question on participant's sex was included in the survey self-completion questionnaires for the first time in addition to the usual approach of the household reference person providing this information for everyone in the household as part of the main CAPI interview.
Where the respondent completed a self-completion questionnaire, their response to the sex question here took precedence over the CAPI data. However, in the self-completion questionnaire, the sex question included the option of 'prefer not to say'. In addition, respondents could choose not to answer the question. Any such cases where the sex data was missing or 'prefer not to say' had been selected are not included in the breakdowns for men and women in the data tables but are included in the 'All adults' totals. As such, base numbers for all adults are greater than the sum of the men and women base numbers where these are reported separately.
Contact
There is a problem
Thanks for your feedback