Scottish Housing Market Review Q1 2023
Scottish housing market bulletins collating a range of statistics on house prices, housing market activity, cost and availability of finance and repossessions.
This document is part of a collection
6. Mortgage Interest Rates
In March 2020, Bank Rate was cut by a total of 65 basis points to 0.1% as a result of the Covid-19 pandemic. More recently in response to the rise in inflation, the Bank of England has increased the Bank rate eleven times since December 2021, most recently by 50 basis points in February 2023 and by 25 basis points in March 2023. Since December 2021, Bank rate has increased by 415 basis points to 4.25%, its highest level since 2008.
A 415 basis point increase in interest rates is estimated to increase the monthly payment by around £370 per month for an average new variable rate and by around £200 per month on the average outstanding variable rate mortgage in Scotland.
Chart 6.1 and Chart 6.2 show data on the effective (or average) interest rates on outstanding mortgage balances and new mortgage advances. (Source: BoE). From December 2021 to January 2023, the increases in mortgage rates have been below the cumulative 340 basis point increase in Bank Rate during this period: the average variable rate on outstanding mortgages increased by 285 basis points to 5.17%, the average variable rate on new advances increased by 269 basis points to 4.29%, and the average fixed rate on new advances increased by 224 basis points to 3.82%. The average fixed rate on outstanding mortgages has started to increase, albeit by only 23 basis points since December 2021 to 2.17% as at January 2023.
Effective Monthly Mortgage Interest Rates (UK)
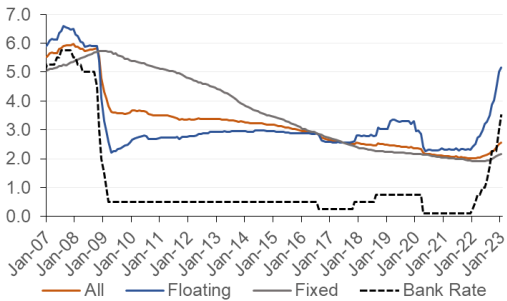
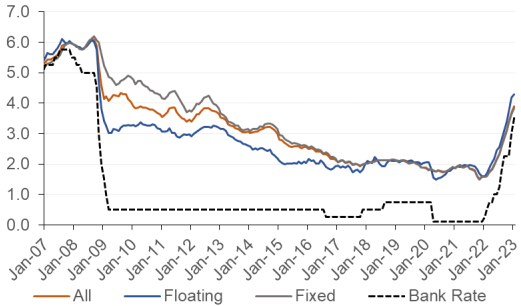
Source: Bank of England
As shown in Chart 6.3, the spread between the average advertised rate on 2 year fixed 90% and 75% LTV mortgages increased during the pandemic from 51 basis points in April 2020 to 189 basis points in December 2020. However, since then the spread has returned towards pre-pandemic levels, with the spread equal to 56 basis points in February 2023. (Source: BoE).
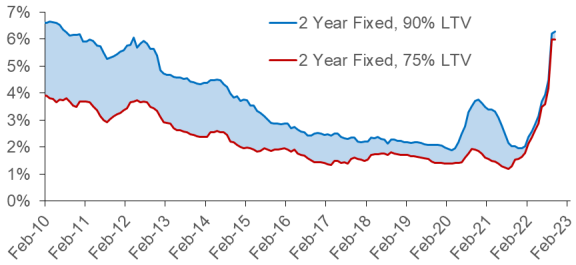
Source: Bank of England
Moneyfacts’ data for 1 October 2022, after the UKG Plan for Growth/mini-Budget on 23 September, shows that the average quoted two-year and five-year fixed rates had increased by 119 and 90 basis points relative to 1 September 2022, reaching 5.43% and 5.23% respectively. By 20 October, both of these rates had breached 6%, with the average two-year rate at 6.65% and the average five-year rate at 6.51%. Since then, the average two-year and five-year fixed rates have fallen slightly, with the average two-year fixed rate at 5.32% and the average five-year fixed rate at 5.00% as at 1 March 2023. (Source: Moneyfacts Mortgage Treasury Report and news release).
Chart 6.4 shows that the vast majority of regulated[1] mortgages are on fixed rates, with 94.5% of new mortgages and 87.2% of outstanding mortgages on fixed rates as of Q4 2022. The corresponding figures for unregulated[2] mortgages are 94.2% and 76.8%. (Source: FCA). However, the sustained increase in mortgages on fixed rates appears to be slowing, most likely due to the interest rate on new fixed rate mortgages increasing, as shown in Chart 6.2.
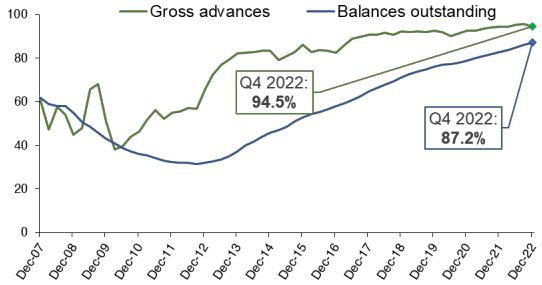
Source: FCA
Contact
Email: William.Ellison@gov.scot
There is a problem
Thanks for your feedback