The Environment Strategy for Scotland: Delivering the Environment Strategy Outcome on Scotland's Global Footprint - Evidence Base & Policy Levers
This report presents evidence and initial recommendations on how the Scottish Government could use the available policy levers to help ensure Scotland’s international environmental impact is sustainable.
4. Section 1: Measuring Scotland’s international environmental impact
4.1 Scotland – What makes it special?
Over the past three decades, Global Footprint Network has worked on sustainability projects with nations, regions, cities, businesses, NGOs, universities, communities and others around the world. One thing that has always struck us is that successful sustainability work is often based on whether those carrying it out recognise and harness their own strengths and characteristics.
So, our starting point builds on recognising what makes Scotland special, at least from our vantage point. As outsiders and observers, we sense the following about Scotland:
Nature shapes Scotland’s identity as well as endows it with incredible natural wealth. Its natural abundance and nature being seen as a cultural asset make Scotland particularly suited to play a positive role in humanity’s efforts to tackle these global challenges.
Scotland is a small nation that has often punched above its weight over the centuries. At different times, it has been a centre of The Enlightenment, a key hub of the Industrial Revolution, a pre-eminent medical research centre and, in more recent times, a powerhouse in the practical deployment of wind energy.
This demonstrates that Scots can pride themselves for being forward-thinking, generous and open people. Scotland wants to make its contribution to the world and share it with the world. It wants to be a global citizen in deeds, not just in fine words. Its track-record proves it. Hence the genuine question about how to reduce Scotland’s overseas impact.
Creating a sustainable world requires these characteristics in abundance. As a species, we will not solve the climate or nature emergencies or other challenges such as inequality of wealth and opportunity without considerable co-operation and openness being brought to the fore.
We, therefore, recommend that these compelling general and natural characteristics of Scotland are kept front of mind when designing and evaluating policy options in this project.
4.2 The context of overshoot
Humanity has entered a new age, living on a planet dominated by human presence. Some have called it the “Anthropocene”[1]. It is characterized by human activities having started to exceed what the biosphere can replenish. Simply said, humanity is operating in overshoot. Human demand exceeding ecosystem regeneration means that a portion of demand results in either ecosystem depletion or waste accumulation. Hence, overshoot is a situation that can only be maintained temporarily.
The persistence of global overshoot, now for over half a century, has led to an accumulated ecological debt, leading to huge decline in biodiversity, excess greenhouse gases in the atmosphere and heightened competition for food and energy. These symptoms are becoming more prominent with unusual heat waves, forest fires, droughts and floods.
The planetary context of ecological overshoot makes obvious that human activities have entered an ever-stiffer competition for regeneration. Conservative estimates, based on UN data sets, suggest that human demand now exceeds what the planet’s ecosystems can regenerate by at least 75%. In addition, some of the regenerative capacity of ecosystems is also needed by wild species for their survival. Ecologists have pointed out that leaving half of the planet's capacity aside for wild species may enable us to maintain at least 85% of the planet’s biodiversity (Wilson 2016). International agreements are inching in this direction, with the latest biodiversity convention, COP15, calling for conserving 30% of the planet’s terrestrial and marine habitat by 2030.
This gap between how much humanity demands and the level of demand that the planet can tolerate indicates that currently, humanity’s demand on our planet’s biological regeneration is over three-fold[2] too large. This makes it obvious as to why regeneration, i.e. the biological services that the planet provides, is becoming the material bottleneck for the human economy.
4.2.1 Approaching “impact” in the context of overshoot
Recognising this context helps us more clearly define key terms of the research question, because the terms it uses, such as “impact” and “sustainable” are ambiguous. “Impact” is a broad and common term but lacks a specific definition. It is an umbrella expression referring to consequences of an action. In some arenas, such as in “impact investment”, impact refers to ancillary benefits. In the environmental domain, impacts typically refer to detrimental effects. Given the Anthropocene, we propose prioritizing a more specific “impact” for this report, one that is particularly relevant in the current context of persistent global overshoot.
Overshoot makes clear that “competition for regeneration” has grown into a key dynamic. Hence, mapping humanity's competing demands for biocapacity becomes a helpful navigational aid for managing our economies’ resources.
A deeper explanation of the approach, its underlying assumptions, practical application principles and methods used, is provided in Appendix B. That piece explains in more detail why most “environmental challenges” boil down to a competing use of regeneration. Whether it is access to minerals, the use of fossil fuels or production of food – all these activities are limited by regeneration.
Therefore, in the context of this report, we consider impact primarily in terms of “demand on regeneration”. In the case where other, specific detrimental impacts on the environment are discussed, we will more clearly define them, as in the case of biodiversity loss or pollution.
4.2.2 A hierarchy of impacts
Viewing the human-nature relationship through the lens of regeneration addresses fundamental aspects of sustainability but is not inclusive of all environmental sustainability issues. It does not reflect the full complexity of biodiversity, the nuisance of noise, overuse of rare minerals, health outcomes related to air and water pollution, or human diseases. But it covers most other aspects. Overuse of regeneration may even be an enabler of these more specific environmental damages.
Still, the regeneration lens illustrates that there is a hierarchy among impacts (see Figure 1). Operating in the era of persistent global overshoot, with human demand largely exceeding what ecosystems can regenerate, the impact hierarchy becomes the following:
Given the “competition for regeneration” in the context of global overuse, the primary question is one of quantity: “How large are human demands compared to ecosystem regeneration?” This lens makes quantity the primary focus of an impact analysis because exceeding regeneration rates inevitably leads to overuse and depletion somewhere. Furthermore, protecting one area from overuse without reducing human demand inevitably displaces the impact to somewhere else with no net improvement.
Ultimately, human needs depend on material inputs that our planet’s natural systems can regenerate. Hence it is essential to protect and maintain the health and productivity of ecosystems. However, protection and maintenance of high-quality ecosystems cannot be replicated across all ecosystems if the overarching material imbalance, i.e. human demand exceeding ecological regeneration, is not rectified. Focusing on the quantity of resource flows demanded versus regenerated provides an absolute measure of this imbalance.
Conversely, with the quantitative imbalance being addressed, it is possible to improve quality at scale. Hence, quality is secondary in this hierarchy.
For instance, regenerative agriculture that maintains soil health and larger agricultural variety would be a quality improvement over intensive monocropping. Another example is the need to provide for carbon sequestration. If this is achieved by restoring ecosystems, then this addresses both quantity (e.g. amount of greenhouse gases) as well as quality (e.g. healthier ecosystems, with biodiversity benefits) simultaneously. Clearly, sustainability ultimately depends on quality being scaled if we want to be able to maintain ecological health. But for that goal, addressing the quantitative imbalance is a precondition.
Since regeneration does not, as discussed, cover all aspects related to environmental sustainability, additional specific issues fall into the tertiary category of this hierarchy. For instance, noise, overuse of rare minerals, or diseases are not directly addressed by the regeneration lens but are nevertheless impacts that would need to be mitigated. Because symptoms of ecological overuse are often visually striking and morally compelling, sustainability solutions often focus on secondary and tertiary issues through a damage minimization or symptom reduction approach rather than the underlying drivers of ecological overuse.
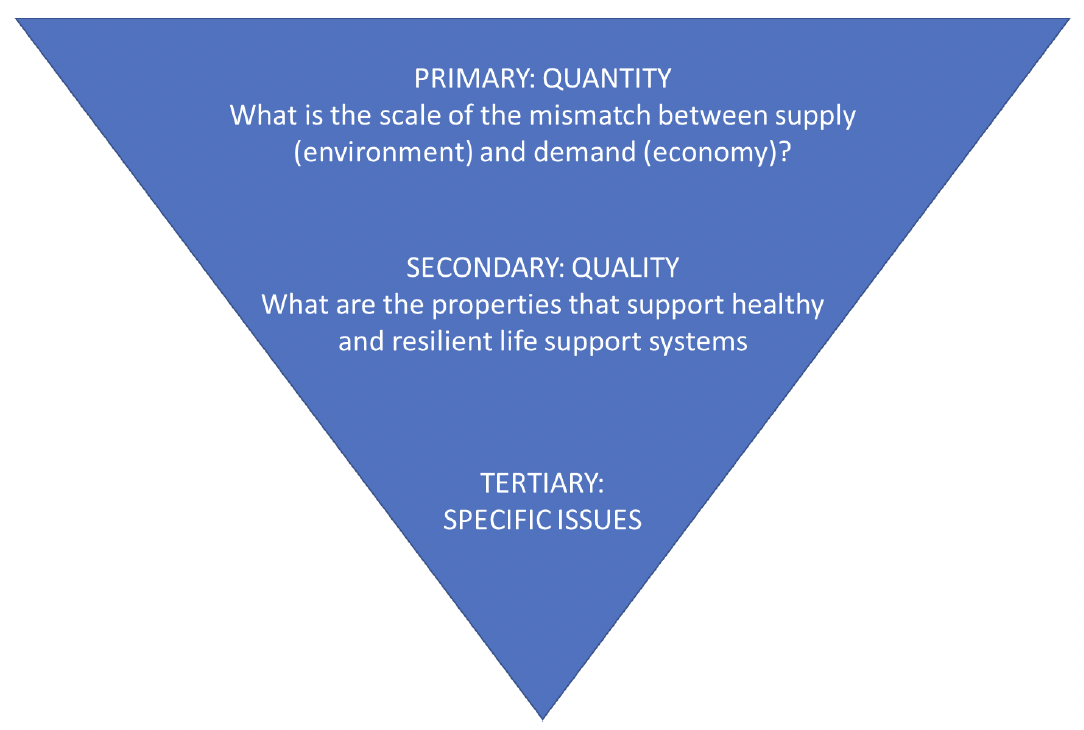
As a result, we approach Research Question 1 through the lens of this hierarchy. This is why we first map the quantity of demands on regeneration, as well as the quantity of regeneration available. This mapping could also provide a starting point for considering quality issues, as the basic land types are distinguished. For instance, urban land used to accommodate cities compromises regeneration and biodiversity. Again, not every unit of urban land is equal. Some is more ecologically friendly, with more green space, lower pollution levels, more trees, more permeability for water, etc. Or cropland can be used for intensive mono-cropping, or it can be farmed in ways that offer greater protection for the health of the soil and of biodiversity.
In other words, establishing overarching quantitative accounts (primary impact) provides a baseline for the evaluation of the quality of use of these areas (secondary impact), and then to test whether there are any other issues on those areas (tertiary impact) that have not been addressed by the quantity or quality analysis of demand on regeneration.
This report addresses the primary tier, providing a first estimate quantitative analysis of Scotland’s biocapacity and its Ecological Footprint of consumption. A more complete analysis, including additional Scotland-specific data, would also examine Scotland’s production Footprint[3].
4.3 The meaning of sustainability and how we approach it here
A first task in addressing the research question is to track impacts on the environment. In addition, for interpreting impacts, we need to know how much impact the environment can absorb. After all, all human activities require material inputs, and nature does provide us with such input. The challenge is to ensure that the demand stays within an amount that the biosphere can regenerate.
It is more straightforward to define what is “not sustainable”. Anything that continually degrades ecosystem regeneration capacity, through overuse or damage, cannot be maintained forever, and is therefore unsustainable. The quantitative condition of staying within the “ecological budget” or demanding less than ecosystems regenerate is therefore not a proof of sustainability, but a necessary (yet not sufficient) condition for sustainability.
Sustainable consumption would require safeguarding some amount of the planet’s biocapacity budget for the maintenance of biodiversity, so this must also be taken into account. Ecologists (such as E.O. Wilson) and conservationists (such as the natureneedshalf coalition) have made the case that people using more than half of the planet's “budget” is destructive for biodiversity. The newest biodiversity agreement, CBD-COP15 “Kunming-Montreal Global Biodiversity Framework”, aims to set aside 30% of the land for biodiversity protection before 2030.
Further, the areas being used need to be used in ways that maintains their biological integrity. UN data sets applied to national Footprint assessments are more complete on harvests and waste production, and do not provide direct information on damage to ecosystems. This means the numbers presented in this report most likely overestimate biocapacity and underestimate Footprint demands.
Also, the biocapacity estimates in this report represent current levels of regeneration. In the context of rapid and accelerating climate change, the likelihood of extreme weather events increases. This includes more potential for floods and droughts, disruption of growing seasons, migration of pests and invasive species etc. Such disruptions could make highly intensive production systems even more vulnerable. All this increases the potential for agricultural outputs not only fluctuating, but also being compromised. Therefore, to increase economic resilience, larger ecological margins may need to be considered to safeguard Scotland’s resource security.
Finally, some apply the term “sustainable” even more broadly, including social dimensions, such as social equity, policy acceptability, and inclusion. They would make the valid case that situations that societies are not happy with will not last either.
Given this wide and sometimes ambiguous use of the term “sustainable”, we focus here on a core, measurable aspect, which is: To what extent do human demands fit within the regenerative capacity of ecosystems?
4.4 We are entering a new era
4.4.1 The future we anticipate
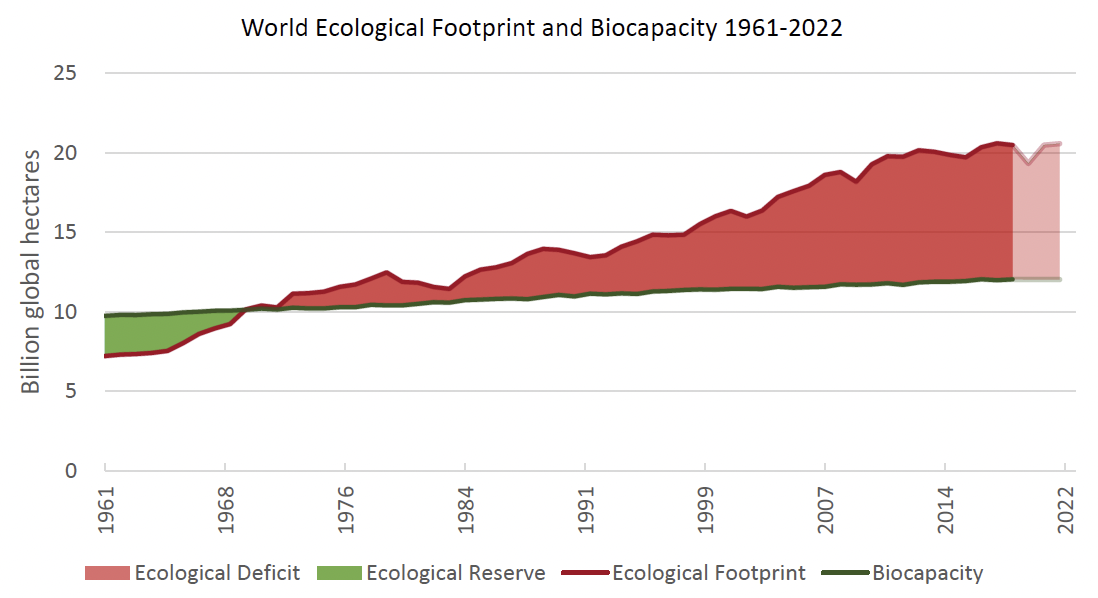
While we cannot accurately predict the future, there are many aspects of the future that we can anticipate with high confidence. Since the early 1970s, humanity’s metabolism has exceeded the regeneration of our planet, putting us in a state of persistent global overshoot. At present, humanity’s material metabolism is exceeding Earth’s regeneration by 71%, as stated above and shown in Figure 2. The cumulative impact has left an ecological debt that is shifting the context in which humanity operates.
These persistent trends make the future more predictable. We know not only that people will want to eat, be housed, have fun, feel safe. We also know that we will live in a world with far more climate change and other impacts caused by ecosystem depletion. With near certainty, any imaginable scenario will include increased climate-related disruption and resource scarcity. Mitigating the impacts of climate change will come at the cost of more rapidly phasing out fossil fuel, which will reduce reliable agricultural and forestry outputs; conversely, delaying decarbonization will lead to more rapid acceleration of climate change, which will tighten the strain on the planet’s biological resources through climate disruptions. This future is approaching more rapidly than companies, cities and countries may be able to adapt, given the physical inertia of infrastructure.
4.4.2 What biocapacity offers as a lens
From an ecological perspective, Earth has a finite amount of biological production or regeneration that supports all life. This is called biocapacity. Given that biocapacity is humanity’s physically most limiting factor, Ecological Footprint and biocapacity accounting reveals key risks and opportunities related to a future with more climate change and resource constraints. It addresses the essence of the sustainability challenge by comparing the amount of bio-productive surface area demanded by people (Ecological Footprint), with the planet’s ability to regenerate (biocapacity). A foundational measure for the sustainability domain, Ecological Footprint (hereafter Footprint) accounts provides an integrated, multiscale approach to tracking the use and overuse of natural resources. Once basic resource demands are understood, the analysis can be extended to address more specific concerns, including deforestation, water stress and biodiversity loss, which themselves are also related to overusing biocapacity.
Footprint assessments encompass pressures associated with economies’ resource metabolism – food, energy, carbon emissions etc. To assess these pressures, we start with the National Footprint and Biocapacity Accounts, computed annually for many countries globally (York University 2023). Combined with Multi-Regional Input Output Assessments, the composition of national resource flows, including breakdowns by consumption categories, can be deduced. To understand the Ecological Footprint of a region within a country, in this case Scotland within the UK, we use a top-down approach, with local data to distinguish the country performance (UK) from the regional performance (Scotland) to provide insights into more specific resource demands of the region. See Appendix B for further details.
Like any accounts, Ecological Footprint accounting is a systematic way to document historic performance. It is not a normative indicator of progress. However, it provides context for users to set their targets. Its descriptive nature allows the metric to be applied across broad contexts, which is a key element of sustainability-assessment frameworks. This makes the Ecological Footprint relevant across a wide range of sectors and socio-political entities, each with their own unique cultures, natural systems and methodological approaches to sustainability responses.
4.4.3 How to thrive in this future?
Whether Scotland can thrive in the predictable future of climate change and resource constraints will depend on the ability of its infrastructure, production systems and supply chains to operate in this new context.
The question is: which assets will be able to operate, and therefore be valuable to both the investor and society, in this predictable future? Our hypothesis is that those assets which reduce global overshoot when they expand will be more valuable, because they will be less vulnerable to physical constraints. Such assets, whether infrastructure, production systems or supply chains, will be more resilient to shocks and shortages. If a country’s assets can meet the future needs of its inhabitants, they will have true value.
If we accept this hypothesis, then understanding a country’s resource performance is central, and this is the focus of answering Research Question 1: “What does evidence tell us about the impact of Scotland’s consumption and production on the natural environment in other countries around the world, and the extent to which this is sustainable?”
4.5 Evidence base: key findings from the analysis
4.5.1 UK and Scottish resource context
Contrasting a country’s biocapacity with its Ecological Footprint broadly summarizes its resource situation. The need to contain humanity’s Footprint within the planet’s biocapacity is a fundamental sustainability condition because the planet has no option to compensate for this imbalance with input from somewhere else. This echoes the key message from the 2021 Dasgupta Review that our economies and societies are embedded in nature, and must operate within its sustainable limits. A global natural resource deficit implies ecological overshoot with the inevitable consequence of degradation and depletion of natural capital and waste accumulation. Economically speaking, it is like living off asset liquidation rather than off the interest generated by capital. Individual countries, however, can maintain a biocapacity deficit because they can make up the difference with trade, as long as they have enough purchasing power.
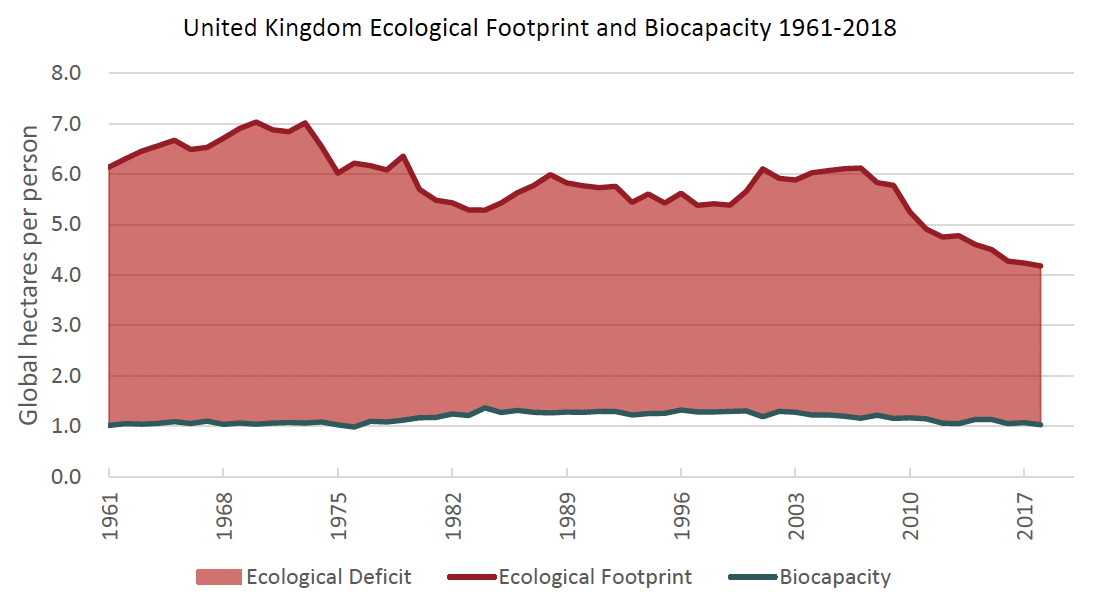
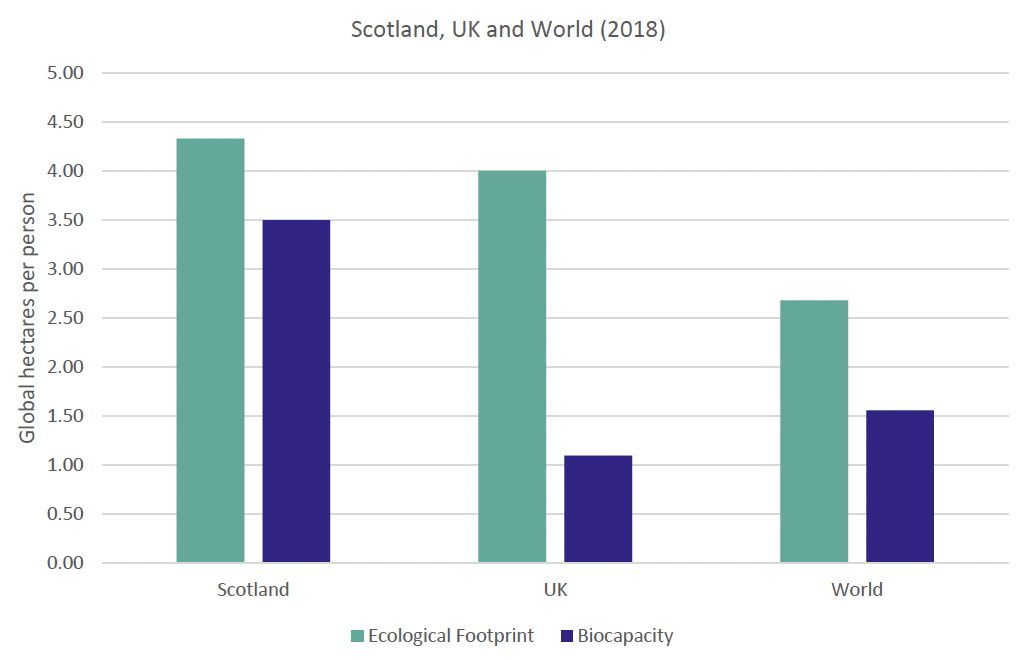
According to the National Footprint and Biocapacity Accounts (NFBA; York University, 2022), the UK’s Ecological Footprint per person amounts now to 4.2 global hectares per person, but has declined steadily by an average of 3.6% per year since its most recent peak in 2007. Most of the decrease is associated with decreases in the carbon Footprint, both in domestic production, as a result of cleaner electricity generation and reduced fuel consumption, electricity use and transport emissions; and also in the Footprint of imports. Still, the UK is operating with a large biocapacity deficit: it demands over 4 times the biocapacity of its natural resource base (Figure 3). At present, Scotland does not feature separately from the UK in the National Footprint and Biocapacity Accounts, and thus a similar understanding of Scotland’s resource intensity over time does not yet exist.
However, a study by The University of Stirling and Global Footprint Network (Horsburgh et al., 2022) estimated Scotland’s biocapacity for 2018, allowing the comparison with Scotland’s 2018 Ecological Footprint (produced in this research) to give an indication of Scotland’s resource context, relative to the UK and rest of the world for 2018.
Using the approach outlined in Appendix B, the present analysis estimates Scotland’s Ecological Footprint of consumption in 2018 at 4.33 global hectares (gha) per person or 23.6 million gha (Table 1) when scaled by Scotland’s 2018 population estimate of 5,438,100.
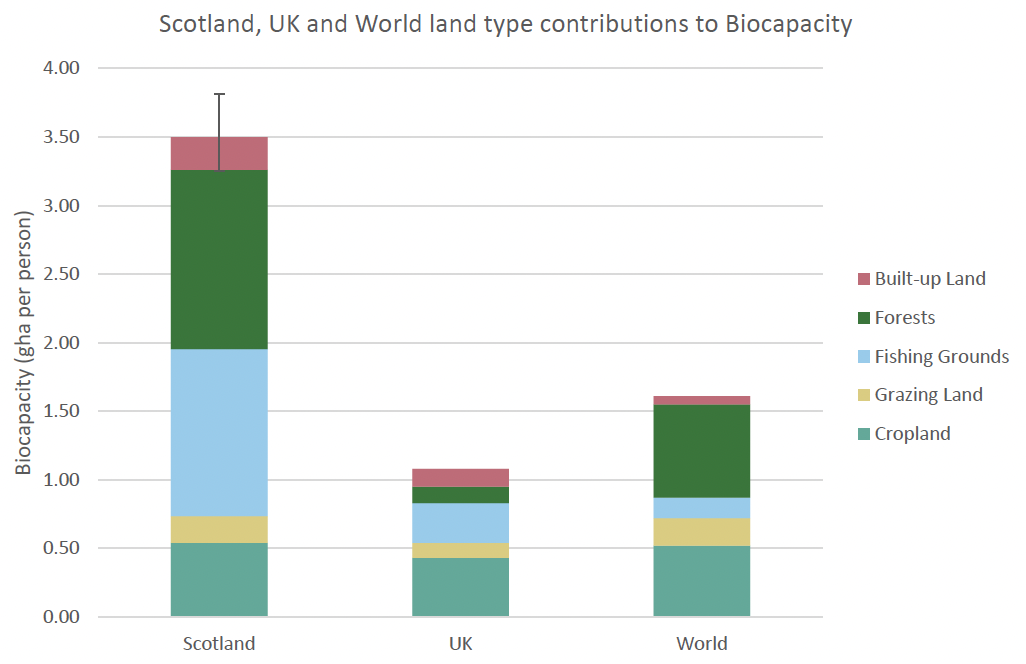
Scotland’s biocapacity for 2018 is estimated to be 3.5 gha per person, or 19.02 million gha. On a per person basis, this is over three times the UK 2018 biocapacity of 1.1 gha per person and more than double the average global biocapacity of 1.6 gha per person (Table 1).
| Footprint Category | Ecological Footprint (EF) | Biocapacity (BC) | BC-EF |
|---|---|---|---|
| Crop land | 4,460,720 | 2,933,952 | -1,526,768 |
| Grazing land | 1,403,854 | 1,068,368 | -335,485 |
| Fishing grounds | 448,666 | 6,610,102 | 6,161,435 |
| Built-up land | 729,819 | 1,298,864 | 569,045 |
| Forest (Wood Products) | 2,426,742 | ||
| Forest (Carbon Footprint) | 14,091,344 | 7,112,800 | -9,405,287 |
| Total | 23,561,145 | 19,024,085 | -4,537,059 |
In contrast with the UK and rest of the world, Scotland thus has a greater wealth of biocapacity per person. While this is partly due to Scotland’s low population density, Figure 4 shows that Scotland also has a resource advantage due to a relative wealth of marine and forest biocapacity. This stems from Scotland’s large shelf sea area, and its coniferous plantations, which account for over 60% of the UK’s forestry production. In a world of persistent overshoot, having domestic biocapacity can both mitigate risks and provide opportunities related to climate change and resource constraints and warrants careful consideration in long-term management.
To gain an understanding of Scotland’s resource intensity, biocapacity needs to be compared with the Ecological Footprint. Comparisons of the biocapacity and Footprint of Scotland, the UK and world (Figure 5) show that Scotland has a relatively large Ecological Footprint per person (larger than that of the UK or world; reasons for this are discussed below). Figure 5 also shows that Scotland’s substantial Footprint is offset to a large extent by its wealth of biocapacity, leading to a smaller relative ecological deficit than that of the UK or world. However, care must be taken not to place too large an emphasis on Scotland’s biocapacity advantage.
As shown in Table 1, despite Scotland’s large forest and marine biocapacity, it is nonetheless operating with a biocapacity deficit of over 4.5 million gha (or 0.83 gha per person). Scotland’s excess consumption can manifest domestically as the overuse of domestic ecosystems, which leads to deforestation, biodiversity loss and other symptoms, however some of Scotland’s biocapacity deficit is met by importing the difference from overseas. Given global overshoot, this deficit therefore leads inevitably to depletion elsewhere.
Further, Footprint categories in Table 1 reveal large biocapacity deficits in cropland (linked with food and textile consumption) and the carbon Footprint (linked with emissions in all consumption domains). The consumption categories linked with cropland and carbon Footprint thus provide potential opportunities to improve Scotland’s overseas Footprint. As Scotland is also tied into the UK economy, which runs an even larger biocapacity deficit, paying attention to resource flows and dependencies is particularly relevant, and could guide economic development strategies that enhance Scotland’s chances to operate effectively in the predictable future of climate change and resource constraints.
To manage the consumption Footprint more effectively, Footprint results can be broken down by consumption categories. This breakdown is produced through input output assessments (see Box 1) and results in a Consumption Land Use Matrix (CLUM). Table 2 shows a summarized version by consumption domains. Appendix A contains the full table.
Box 1. Consumption Land-Use Matrix results are derived from an Ecological Footprint Extended MRIO (Multi-Region Input Output) model and therefore include all inputs within the global supply chain associated with final demand spending or consumption. The MRIO framework considers three types of final demand: household consumption, which includes goods and services directly purchased by households; government consumption, which includes goods and services purchased by governments; and gross fixed capital formation consumption, which includes purchases of fixed investments or durables good such as infrastructure or shelter. Ultimately all goods and services consumed can be framed as a provision for human needs (Food, Housing, Transportation, Goods, and Services) either directly purchased by households, paid for by government, or provided by fixed capital formation which was paid for in the past. A detailed list of subcategories can be found in Appendix A.
This CLUM is the core offering of the research presented here and it provides a mapping of Scotland’s resource dependence. Not only does it provide an estimate of Scotland’s Footprint by various consumption categories, for instance Food, and sub-categories, for instance fish and seafood consumption. Also, it makes estimates of Scotland’s Footprint available by country of origin. Note, because of data limitations, “overseas” in this analysis refers to originating from outside of the UK, and “domestic” refers to originating within the UK.
High level results show that 47% of Scotland’s Footprint originates from overseas. Food comprises the largest overseas Footprint among all consumption categories, with food harvested overseas making up over 10% of Scotland’s total Footprint (Table 2).
The CLUM results also provide insights into Scotland’s large per-person Footprint. Compared to the UK, the portion of the Scottish Ecological Footprint that is paid for directly by households is lower. However, the Ecological Footprints portion paid for directly by the government (such as policing, teaching or providing healthcare) and fixed capital investments (such as constructing roads and buildings), on a per person basis are much larger in Scotland, resulting in an overall larger per-person Footprint.
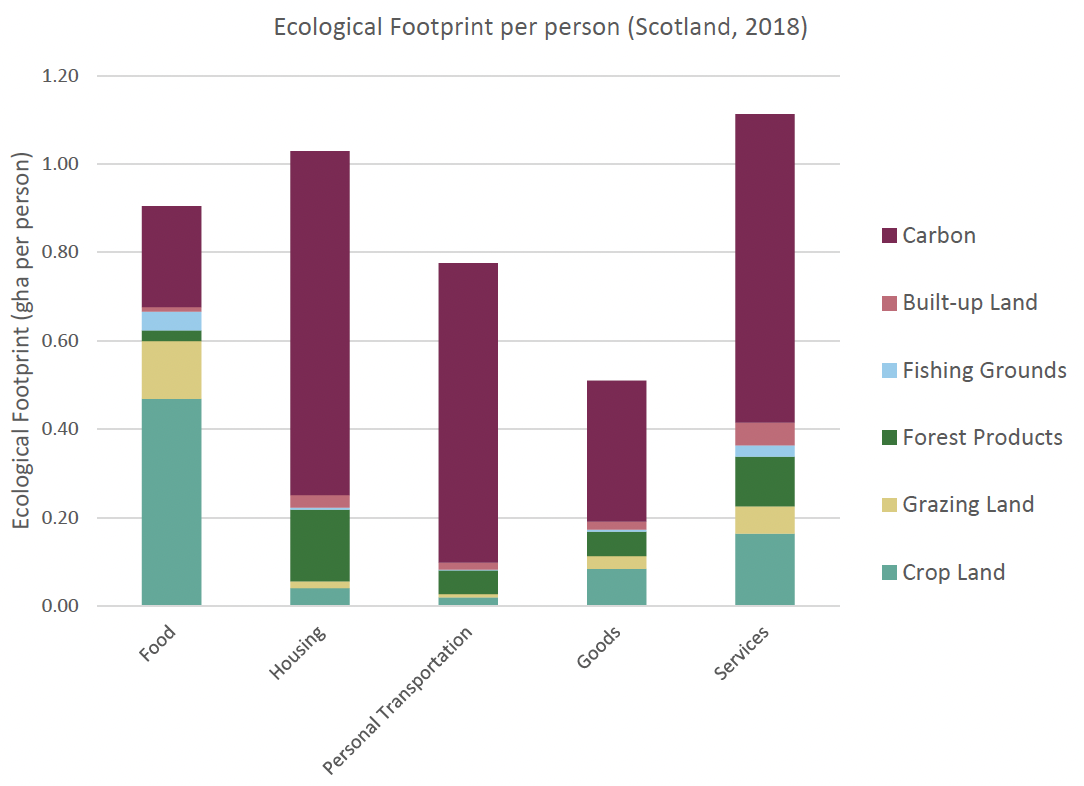
Within the Ecological Footprint directly paid for by households (Figure 6), food is the largest contributor, followed by personal transportation, then services. Because CLUM results include all supply chain inputs, all consumption categories contain inputs from all land-use types. The food Footprint, for example, contains all food producing land-types (cropland, grazing land, fishing grounds) but also built area, forest product, and carbon Footprint representing the infrastructure and wood and fibre products, and carbon emissions from energy use, packaging, and transportation that are associated with providing food for households.
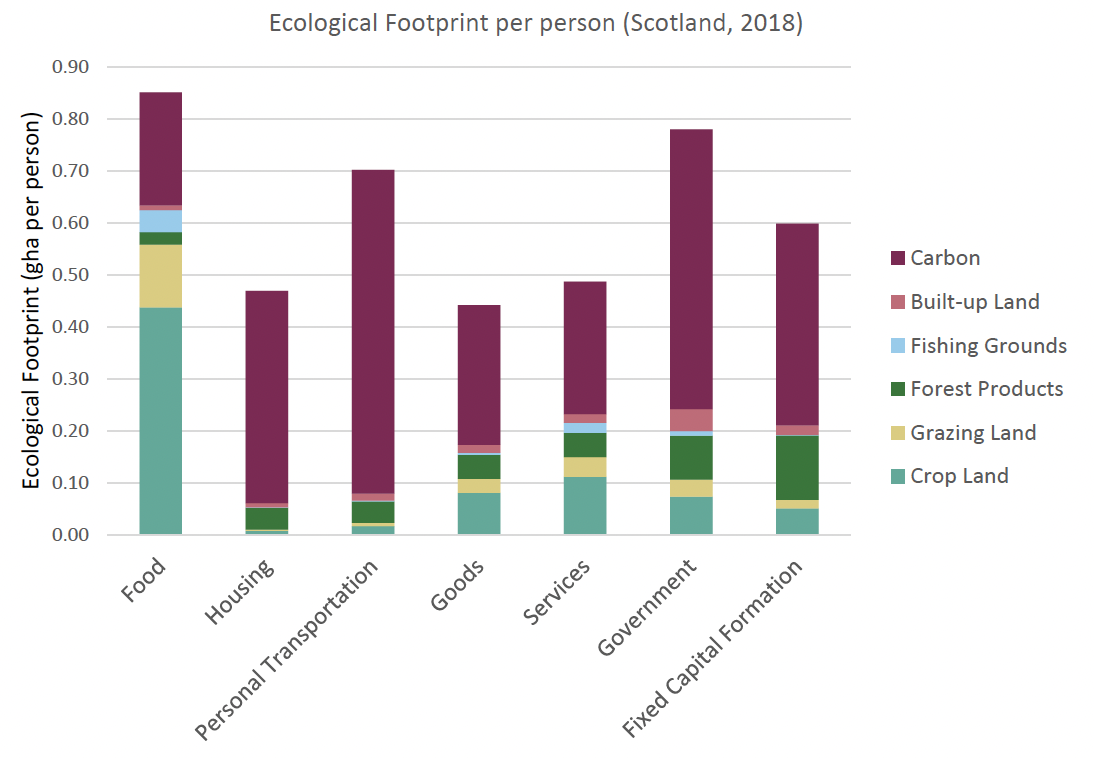
Ultimately, consumption paid for by governments and fixed capital investments for long-term assets also serve the five basic need categories (food, housing personal transportation, goods, services). Therefore, these two domains can also be re-integrated into the five final household categories as indicated in Figure 7. When including those two aspects in the five basic categories, services and housing become the two largest segments of Scotland’s Ecological Footprint. Housing becomes dominant because building and maintaining houses is resource intensive, not just operating them.
This reallocation of consumption paid by government and expenditure for fixed capital investment turns the CLUM into a three-dimensional representation of Scotland’s resource demand: each cell of the CLUM is also broken down by who pays for it, and whether it is short-term consumption or an investment into lasting capital stocks.
For example, in the case of Scotland, it shows that for every unit of resource households require to operate housing, there are another 2.2 units of resources needed to build and maintain that infrastructure. The analysis also shows that 38% of the Footprint for construction is sourced from overseas.
The current CLUM also becomes a starting point for constructing an ideal CLUM, one that is compatible with the planetary resource budget. Different portions of the CLUM can be optimized more easily than others. For example, there are alternatives to high-Footprint electricity. But there may be less opportunity to reduce the Footprint of a carrot. Also, it is possible to live with very little operational energy through a Scottish winter, if the house is set up well. All these insights help develop practical resource use goals, which then can be summarized in the ideal CLUM. This CLUM then becomes the testing ground against which all policy proposals can be evaluated.
4.5.2 Scotland’s overseas Footprint
Table 2 below is the essence of part one of this study. It provides the overarching answer to the posed research question on the demand Scottish consumption puts on environments outside of the UK. Appendix A provides a more detailed version. The percentage figures in the table indicate how much of the 4.33 global hectares (gha) per person Footprint is associated with each matrix cell. Carbon Footprints are allocated to where the emissions occurred.
| Ecological Footprint | Total | Cropland | Grazing Land | Forest Products | Fishing Grounds | Built-Up Land | Carbon | ||||||||
|---|---|---|---|---|---|---|---|---|---|---|---|---|---|---|---|
| Total | UKOrigin | Foreign Origin | UKOrigin | Foreign Origin | UKOrigin | Foreign Origin | UK Origin | Foreign Origin | UKOrigin | Foreign Origin | UKOrigin | Foreign Origin | UKOrigin | Foreign Origin | |
| Total Ecological Footprint | 100.0% | 53.2% | 46.8% | 9.3% | 9.6% | 2.9% | 3.0% | 5.4% | 4.9% | 0.9% | 1.0% | 1.6% | 1.5% | 33.1% | 26.7% |
| Household Total | 68.2% | 35.3% | 32.9% | 7.5% | 8.3% | 2.2% | 2.5% | 2.3% | 2.8% | 0.7% | 0.9% | 0.8% | 0.8% | 21.8% | 17.5% |
| Food | 19.7% | 10.0% | 9.7% | 5.3% | 5.2% | 1.5% | 1.4% | 0.3% | 0.3% | 0.3% | 0.7% | 0.1% | 0.1% | 2.5% | 2.0% |
| Housing | 10.9% | 7.9% | 3.0% | 0.1% | 0.1% | 0.0% | 0.0% | 0.6% | 0.4% | 0.0% | 0.0% | 0.1% | 0.1% | 7.0% | 2.3% |
| Personal Transport | 16.2% | 8.1% | 8.1% | 0.1% | 0.3% | 0.1% | 0.1% | 0.3% | 0.7% | 0.0% | 0.0% | 0.1% | 0.2% | 7.4% | 6.8% |
| Goods | 10.2% | 2.9% | 7.4% | 0.4% | 1.6% | 0.1% | 0.6% | 0.4% | 0.8% | 0.0% | 0.1% | 0.1% | 0.3% | 1.8% | 4.0% |
| Services | 11.2% | 6.4% | 4.8% | 1.6% | 1.1% | 0.5% | 0.4% | 0.7% | 0.5% | 0.3% | 0.2% | 0.3% | 0.2% | 3.1% | 2.4% |
| Government | 18.0% | 10.6% | 7.5% | 1.1% | 0.8% | 0.5% | 0.3% | 1.3% | 0.9% | 0.1% | 0.1% | 0.6% | 0.4% | 7.0% | 5.0% |
| Gross Fixed Capital Formation | 13.8% | 7.3% | 6.5% | 0.7% | 0.6% | 0.2% | 0.2% | 1.8% | 1.3% | 0.0% | 0.0% | 0.2% | 0.2% | 4.3% | 4.2% |
The most relevant overarching finding of our analysis indicates that 47% of Scotland’s Ecological Footprint is sourced from areas outside of the United Kingdom (Table 2). The largest imports originate from China, which is the main supplier of Scotland’s consumption for almost all categories (Tables 3a to 3c). Of all consumer categories, food consumption has the largest overseas Footprint. Most of that Footprint originates from European countries (Table 3a). Food is the only category where the largest supplier is not China. The Footprint associated with housing represents the largest proportion of consumption originating domestically in the UK (73%) (Table 3b). Conversely, the Footprint of the goods category has the smallest proportion of consumption originating in the UK (28%) (Table 3a).
4.5.3 Non-carbon Ecological Footprint components
From a total demand perspective, identifying the largest categories of consumption is critical to developing solution pathways. Both carbon and non-carbon Footprints are quantified in terms of their demand on regeneration, however the symptoms of overuse in these categories may differ. For example, over longer time scales, climate change may be the largest driver of biodiversity loss, while in the short term, land use change is the most acute driver. While the carbon Footprint remains the largest demand, this is considered separately through the Scottish Government’s climate change policies and here we focus on non-carbon components of Scotland’s overseas Footprint.
Tables 3a through 3c break down the CLUM categories according to the regional origin of those demands. The top ten countries of origin outside of Europe are separated out in each of the consumption categories.
Food, Goods, and Services represent a major source of Scotland’s non-carbon international Footprint estimated for 2018 and are represented together because they are highly comprised of demand for agricultural products (Table 3a). The majority of cropland and grazing land demand is related to the production of food items such as staple foods, fruits, vegetables and meat, but also the production of fibres and leather for clothing and textiles. Due to the categorization of consumption (COICOP[5]), the largest category in “Services” is also related to food: “catering services” includes all food consumption provided as a service, as in the case of restaurants and related establishments.
Within these categories, food is largely sourced regionally with nearly 80 percent coming from within Europe. Outside of Europe, the largest sources of food do include countries at high risk of biodiversity loss and deforestation in South America and Africa.
Conversely, goods are largely sourced internationally, with 56 percent originating outside Europe, and a large majority, 33 percent, coming from China. The non-carbon Ecological Footprint of goods sourced from China largely comes in the form of clothing, footwear and associated textiles.
Overall, 23% of Scotland’s imported cropland Footprint and 22% of Scotland’s grazing land and forest product Footprint come from regions experiencing the highest potential biodiversity loss (Asia, Africa, and Latin America).
Table 3a: Origin of Scotland’s Non-Carbon Ecological Footprint 2018 – Food, Goods, Services. Data bars illustrate relative value, with orange bars representing relative regional sourcing, while green bars represent relative international sources. Percentages represent the proportion of the individual category by source.
| Source | EF gha (%) | |
|---|---|---|
| Total | 3,564,266 | (100%) |
| Domestic (UK) | 1,760,320 | (49.4%) |
| International (Europe) | 1,066,595 | (29.9%) |
| International (Remaining) | 737,351 | (20.7%) |
| Top International Sources | ||
| China | 105,254 | (3.0%) |
| United States of America | 57,050 | (1.6%) |
| India | 51,980 | (1.5%) |
| Australia | 43,673 | (1.2%) |
| New Zealand | 40,128 | (1.1%) |
| Brazil | 36,063 | (1.0%) |
| Canada | 29,461 | (0.8%) |
| Argentina | 26,697 | (0.7%) |
| South Africa | 22,664 | (0.6%) |
| Viet Nam | 22,335 | (0.6%) |
| Source | EF gha (%) | |
|---|---|---|
| Total | 1,070,112 | (100%) |
| Domestic (UK) | 243,822 | (22.8%) |
| International (Europe) | 226,050 | (21.1%) |
| International (Remaining) | 600,241 | (56.1%) |
| Top International Sources | ||
| China | 351,210 | (32.8%) |
| India | 35,822 | (3.3%) |
| Pakistan | 25,696 | (2.4%) |
| Bangladesh | 21,915 | (2.0%) |
| Viet Nam | 18,890 | (1.8%) |
| Indonesia | 17,668 | (1.7%) |
| United States of America | 17,221 | (1.6%) |
| Turkey | 15,659 | (1.5%) |
| Cambodia | 13,314 | (1.2%) |
| Brazil | 7,589 | (0.7%) |
| Source | EF gha (%) | |
|---|---|---|
| Total | 1,298,775 | (100%) |
| Domestic (UK) | 784,897 | (22.8%) |
| International (Europe) | 263,068 | (21.1%) |
| International (Remaining) | 250,810 | (56.1%) |
| Top International Sources | ||
| China | 77,322 | (32.8%) |
| United States of America | 25,172 | (3.3%) |
| India | 20,904 | (2.4%) |
| Thailand | 10,046 | (2.0%) |
| Australia | 7,102 | (1.8%) |
| Canada | 6,248 | (1.7%) |
| Brazil | 5,883 | (1.6%) |
| New Zealand | 5,684 | (1.5%) |
| Turkey | 5,584 | (1.2%) |
| Viet Nam | 5,416 | (0.7%) |
The non-carbon Ecological Footprints associated with housing and personal transportation (Table 3b) are relatively small and represent demand in the form of current use and maintenance of infrastructure. However, housing and personal transportation represent major Ecological Footprint categories both because they have large carbon Footprints, but also because from a solution perspective, they represent the efficiency of our physical infrastructures. Improvement of physical infrastructures operate on longer timescales, but also present impactful long-term Footprint reductions when addressed early. These critical categories are addressed elsewhere by Scotland’s Environment Strategy and climate change policies.
Table 3b: Origin of Scotland’s Non-Carbon Ecological Footprint 2018 – Housing and Personal Transportation. Data bars illustrate relative value, with orange bars
representing relative regional sourcing, while green bars represent relative international sources. Percentages represent the proportion of the individual
category by source.
| Source | EF gha (%) | |
|---|---|---|
| Total | 370,258 | (100%) |
| Domestic (UK) | 222,612 | (60.1%) |
| International (Europe) | 67,774 | (18.3%) |
| International (Remaining) | 79,873 | (21.6%) |
| Top International Sources | ||
| China | 24,800 | (6.7%) |
| United States of America | 12,482 | (3.4%) |
| India | 3,775 | (1.0%) |
| Egypt | 3,053 | (0.8%) |
| Canada | 3,027 | (0.8%) |
| Rest of Eastern Africa | 2,364 | (0.6%) |
| Tanzania, United Republic of | 1,988 | (0.5%) |
| Uganda | 1,796 | (0.5%) |
| Brazil | 1,551 | (0.4%) |
| Qatar | 1,192 | (0.3%) |
| Source | EF gha (%) | |
|---|---|---|
| Total | 483,113 | (100%) |
| Domestic (UK) | 165,851 | (34.3%) |
| International (Europe) | 147,675 | (30.6%) |
| International (Remaining) | 169,586 | (35.1%) |
| Top International Sources | ||
| China | 79,901 | (16.5%) |
| India | 11,804 | (2.4%) |
| United States of America | 11,708 | (2.4%) |
| Thailand | 5,065 | (1.0%) |
| Rest of East Asia | 4,578 | (0.9%) |
| Turkey | 4,307 | (0.9%) |
| Japan | 4,184 | (0.9%) |
| Korea, Republic of | 3,293 | (0.7%) |
| Canada | 2,934 | (0.6%) |
| South Africa | 2,870 | (0.6%) |
Government and gross fixed capital formation (Table 3c) represent indirect support for multiple categories of human need and are more difficult to interpret with detail. To a large degree, these categories support the direct consumption categories of housing and services. Relevant to this project, gross fixed capital formation represents the largest forest products Footprint, likely because it represents the Footprint associated with the purchase of physical infrastructure such as houses and other buildings. From a solution perspective, these categories represent indirect consumption and are therefore not focused on here.
Table 3c: Origin of Scotland’s Non-Carbon Ecological Footprint 2018 – Government and Gross Fixed Capital Formation. Data bars illustrate relative value, with orange bars representing relative regional sourcing, while green bars represent relative international sources. Percentages represent the proportion of the individual category by source.
| Source | EF gha (%) | |
|---|---|---|
| Total | 1,437,879 | (100%) |
| Domestic (UK) | 849,569 | (60.4%) |
| International (Europe) | 228,846 | (20.3%) |
| International (Remaining) | 359,464 | (19.3%) |
| Top International Sources | ||
| China | 176,387 | (6.0%) |
| United States of America | 43,172 | (1.9%) |
| India | 20,467 | (1.6%) |
| Viet Nam | 8,886 | (0.8%) |
| Thailand | 6,999 | (0.5%) |
| Korea, Republic of | 6,884 | (0.5%) |
| Japan | 6,471 | (0.5%) |
| Malaysia | 5,578 | (0.4%) |
| Canada | 5,310 | (0.4%) |
| Turkey | 5,132 | (0.4%) |
| Source | EF gha (%) | |
|---|---|---|
| Total | 1,245,142 | (100%) |
| Domestic (UK) | 702,534 | (58.7%) |
| International (Europe) | 238,359 | (15.3%) |
| International (Remaining) | 304,249 | (26.1%) |
| Top International Sources | ||
| China | 153,837 | (13.1%) |
| United States of America | 25,992 | (3.3%) |
| India | 15,919 | (1.4%) |
| Canada | 12,283 | (0.7%) |
| Brazil | 7,749 | (0.5%) |
| Turkey | 6,246 | (0.5%) |
| Japan | 6,018 | (0.5%) |
| Korea, Republic of | 5,719 | (0.4%) |
| Malaysia | 5,487 | (0.4%) |
| Viet Nam | 5,260 | (0.4%) |
4.6 Linking consumption with other environmental impacts
The previous sections of the report provide a quantitative assessment of Scotland’s demand for regeneration. The results quantify the Ecological Footprint according to consumption activity, and by location and type of biocapacity demand. The analysis describes the degree to which the total scale of consumption relative to regeneration is “sustainable” or unsustainable. As outlined above, a secondary level would analyse how gently (or intrusively) these areas of biocapacity are used. Here we provide a review of the linkages between consumption and impacts on qualitative aspects of natural systems. These impact categories do not look at the scale of consumption vs regeneration. Rather, biodiversity loss and deforestation are symptoms of overuse of natural systems. These, in addition to water availability, are also factors relevant to the continued “healthy” or “optimal” function of ecosystems. They can be seen as the ability for natural systems to continue to support life through regeneration.
In this section of the report, we aim to summarize the existing evidence linking Scotland’s consumption to biodiversity loss, deforestation and water use based on a review of scientific and grey literature as well as existing datasets. Our approach aimed to identify linkages through research into two lines of evidence: location-specific and category-specific.
Location-specific evidence included direct evidence of Scotland’s overseas impacts and more broad evidence of the impacts of the United Kingdom’s overseas impacts.
Category-specific evidence included general consumption-specific linkages, such as final demand categories (food, housing, transportation, goods, services) and land-demand categories (cropland, grazing, fishing grounds, forest products, built-up land, carbon Footprint), to specific impacts.
The evidence related to consumption specific linkages was often associated with specific countries or regions of impact.
With further analysis, some of these secondary quality aspects could be built into a more comprehensive first-tier quantity assessment (Figure 1). For instance, if agricultural practice leads to soil erosion, then the full Footprint should include the regenerative capacity needed to restore that soil loss. However, this extends beyond the scope of this report, and would require detailed assessments for different quality aspects.
In this section, we explain what additional metrics exist for specific impacts such as biodiversity loss, deforestation and impact on distant fresh water through trade. These impacts represent the more prominent and urgent symptomatic impacts of overshoot. For more detailed results and analysis, tracking these more specific environmental effects adds more depth to an overarching, quantitative biocapacity assessment. For each of these impacts, the section below describes why they are relevant to Scotland’s overseas impact, the key drivers of change and how these relate to consumption. Further information on relevant datasets, additional considerations and unknowns is set out in Appendix C.
4.6.1 Biodiversity loss
Relevance
Biodiversity is a key property of healthy ecosystems, both natural and human managed, and is essential for ecosystems to adapt and thrive. Not only do biodiverse natural systems function well, they are also more resilient.
A wide range of studies have highlighted the scale of biodiversity loss, including the 2019 IPBES Global Assessment, leading many countries to declare nature emergencies.
What are the drivers?
IPBES (2019) identifies 5 major direct drivers of biodiversity loss:[6] changes in land and sea use (including habitat fragmentation), direct exploitation, climate change, pollution and invasive species. Land/sea use change, primarily through the conversion of natural forests and grasslands to intensive agriculture and livestock, is currently the dominant direct driver of biodiversity loss, closely followed by direct exploitation of resources (Jaureguiberry et al., 2022).
The dominant drivers of biodiversity loss differ between terrestrial, freshwater and marine systems. Direct exploitation and climate change are the top two drivers in marine ecosystems while land/sea use change is the top driver in terrestrial and freshwater ecosystems. All five drivers are correlated, or strongly correlated, with the size of the human resource metabolism. This is true even for invasive species who spread into new regions aided by the transportation network, with more resources being transported offering more opportunities for species to migrate. The relative importance of the five drivers is shifting over time. For instance, climate change has been a minor influence on biodiversity in the past decades but may become the dominant driver of biodiversity loss over the next century and beyond.
IPBES (2019) also highlighted that these direct drivers result from a range of indirect drivers. A recent report[7] by the James Hutton Institute evaluated how these indirect drivers apply in Scotland, categorising these drivers as: i) socio-cultural, ii) demographic, iii) economic, iv) technological and v) relating to politics, institutions and governance.
How do these relate to consumption?
Globally, the majority of biodiversity loss is not associated with international trade. Studies show that 75% to 83% of biodiversity loss is due to agriculture land use for domestic consumption while the remainder can be attributed to international trade (Pendrill et al., 2022; Chaudhary and Kastner, 2016). This underlines the reality that biodiversity loss is associated with the volume of the human resource metabolism.
Hence, trade related policies (such as banning certain goods), while important, are fundamentally more limited in their potential to reduce biodiversity loss compared to curbing aggregate human resource demand, including in impacted countries.
Nevertheless, most of the current biodiversity loss that can be linked to consumption in Western Europe is embodied in international trade, primarily coming from Asia and Pacific (33%), Africa (26%), and Central and South America (20%); with food products contributing 74% to that biodiversity loss. Among food, consumption of animal products is the largest driver by far of potential biodiversity loss (Sun et al., 2022; Wilting et al., 2017). Forest products are also a major driver of both biodiversity loss and carbon emissions (Pendrill et al., 2019).
Estimates from this analysis show that 23% of Scotland’s imported cropland Footprint and 22% of Scotland’s grazing land and forest product Footprint come from regions experiencing highest potential biodiversity loss (Asia, Africa and Latin America).
Some agricultural products have greater impact per area of cropland occupied. For example: sugarcane, palm oil, coconut, cassava, rubber, and coffee (Chaudhary and Kastner, 2016). An examination of seven agricultural commodities (beef & leather, cocoa, palm oil, pulp & paper, rubber, soy and timber) found that 28% of the UK’s imported land Footprint comes from countries with high or very high risk of deforestation, land conversion or human rights abuses (WWF and RSBP, 2020).
4.6.2 Deforestation
Relevance
Forests provide habitat for biodiversity, regenerate forest products and represent one of the largest terrestrial carbon stores. Deforestation focuses on marginal impact, but is nevertheless important to consider, as external consumption (i.e. from international sources) can be linked with deforestation effects, as in the case of expanding production of palm oil or soya. Between 2015 and 2020, the rate of deforestation was estimated at 10 million hectares per year (FAO and UNEP 2020). Deforestation has both climate as well as biodiversity impact.
What are the drivers?
Major drivers of deforestation include land use change for extending agriculture, harvest of forest products and wildfire. In the tropics, 90-99% of deforestation is linked to agricultural expansion (Pendrill et al., 2022).
How do these relate to consumption?
Agriculture and forest commodity production sectors are identified as the predominant cause of land use change and the largest drivers of deforestation. Southeast Asia, Madagascar, Liberia, Central America and the Amazonian rainforest were identified as hotspots for international trade, deforestation and biodiversity loss (Pendrill et al., 2019). As noted in the biodiversity section above, 28% of the UK’s imported land Footprint comes from countries with high or very high risk of deforestation, land conversion or human rights abuses (WWF and RSBP, 2020).
4.6.3 Water use
Relevance
All life requires water. In some areas it is plentiful, but increasingly it is becoming a limiting factor. In those cases, water use turns into another case of humanity's competition for regeneration. For example, if in a dry area more water is used for domestic applications, less will be available for agricultural use, reducing yields. Or, polluting water puts demands on infrastructure and energy to manage and clean that water, reducing opportunities to use that energy elsewhere.
Water being such a central input warrants more specific metrics. A basic one is a water balance, tracking how much is being used, compared to how much is available given rainfall and recharge rates. The UN considers regions where more than 25% of its renewable freshwater is being withdrawn as water stressed. It estimates that 2.3 billion people live in water-stressed countries. Complementary measures are needed since water resources can be harmed in so many ways, including diversion, pollution and salination, over-exploitation and physical modification of water bodies.
The water footprint is one metric to estimate overall water demand, including both direct use as well as indirect, such as water embodied in the products being consumed (the virtual water in trade).
What are the drivers?
72% of all water withdrawals are used by agriculture, 16% by municipalities for households and services, and 12% by industries (UN-Water, 2021). Because water availability is a local factor, water scarcity, the balance between withdrawal and availability, is an important issue in water use. Globally, the drivers of water scarcity are not as well known (Huang et al., 2021).
How do these relate to consumption?
This study did not produce a separate water footprint assessment. However, a study of the UK from 2008, commissioned by WWF, shows that 62% of the UK's overall water demand occurred overseas, based on water footprint assessments. The authors of the study also found that 73% of the external water was used for agriculture (mainly linked to production of food and cotton), the remainder for industrial processes. These numbers reflect the situation for the early 2000s. More details are available in Chapagain and Orr's study on the UK Water Footprint (2008).
4.7 Conclusions
In the first section of this report, we have outlined a comprehensive approach to mapping the impact on an economy during a period of persistent overshoot. Our initial focus is on tracking the overall demand placed on ecosystems' regenerative capacity, as this is the fundamental resource that all activities compete for. To facilitate this analysis, we have provided an overview of Scotland's consumption demand, categorized by different consumption sectors. Additionally, this analysis enables us to determine the proportion of demand satisfied through overseas regeneration.
Furthermore, we have conducted an initial assessment of Scotland's biocapacity. Notably, the per person biocapacity in Scotland is much greater than both the rest of the UK and the global average. Through this resource accounting approach, we have discovered the following insights:
- Scotland’s demand on regeneration, i.e. its Ecological Footprint of consumption, stretches to 4.3 global hectares per person, slightly higher than the UK average of 4.2 global hectares per person.
- Compared to UK’s biocapacity, which is only 1.1 global hectares per person, Scotland’s biocapacity per person (3.5 global hectares) is over three times larger. Still, Scotland runs a biocapacity deficit, with its Footprint per person exceeding its per person biocapacity by an estimated 25%.
- An estimated 47% of Scotland’s consumption originates from countries outside the United Kingdom. Food comprises the largest overseas Footprint among all consumption categories. Goods has the largest portion of its Footprint originating overseas (over 70%), driven, in particular by clothing. Housing is on the other end of the extreme with only one quarter sourced overseas.
A key issue we were not able to assess within the scope of this project is the Ecological Footprint of production – how much regeneration is needed to maintain Scotland’s economy, or its “income machine”. Results are available for the UK as a whole, but we do not know how different that would be in Scotland as the average structure of Scotland might be quite different from the UK average, given the fossil fuel industry of the North Sea as well as the significance of resource-intensive industries such as salmon farming.
As per the ‘hierarchy of impacts’, described above, this assessment provides a quantitative mapping of the biocapacity flows. This assessment could be extended by asking how these flows affect the qualities of the environment from which they originate. Specific issues such as pollution, ecological mismanagement, or localized biodiversity loss, to take a few examples, could then also be monitored and addressed. We highlighted three areas of particular concern in the sections above.
Still, we acknowledge and emphasize that addressing quality issues alone, through direct management of impacts, will not be sufficient to tackle overshoot. Management of impacts needs to be seen in the context of managing our overarching resource budgets.
Contact
There is a problem
Thanks for your feedback