Housing Revenue Account (HRA) Statistics: Scottish Local Authority Housing Income and Expenditure 1997-98 to 2022-23 (near actuals) & 2023-24 (budgeted estimates)
This official statistics publication reports council housing income and expenditure. Trends are 1997-98 to 2022-23 (near actuals) to 2023-24 (budgeted estimates).
This document is part of a collection
5. Rent levels and income from rents (charts 3, 4) (tables 1a, 8, 9)
5.1 In 2022-23 councils raised a total of £1.27bn in income (net of losses from empty properties) from standard rents on dwellings and a further £28m in rent from other HRA properties such as garages.
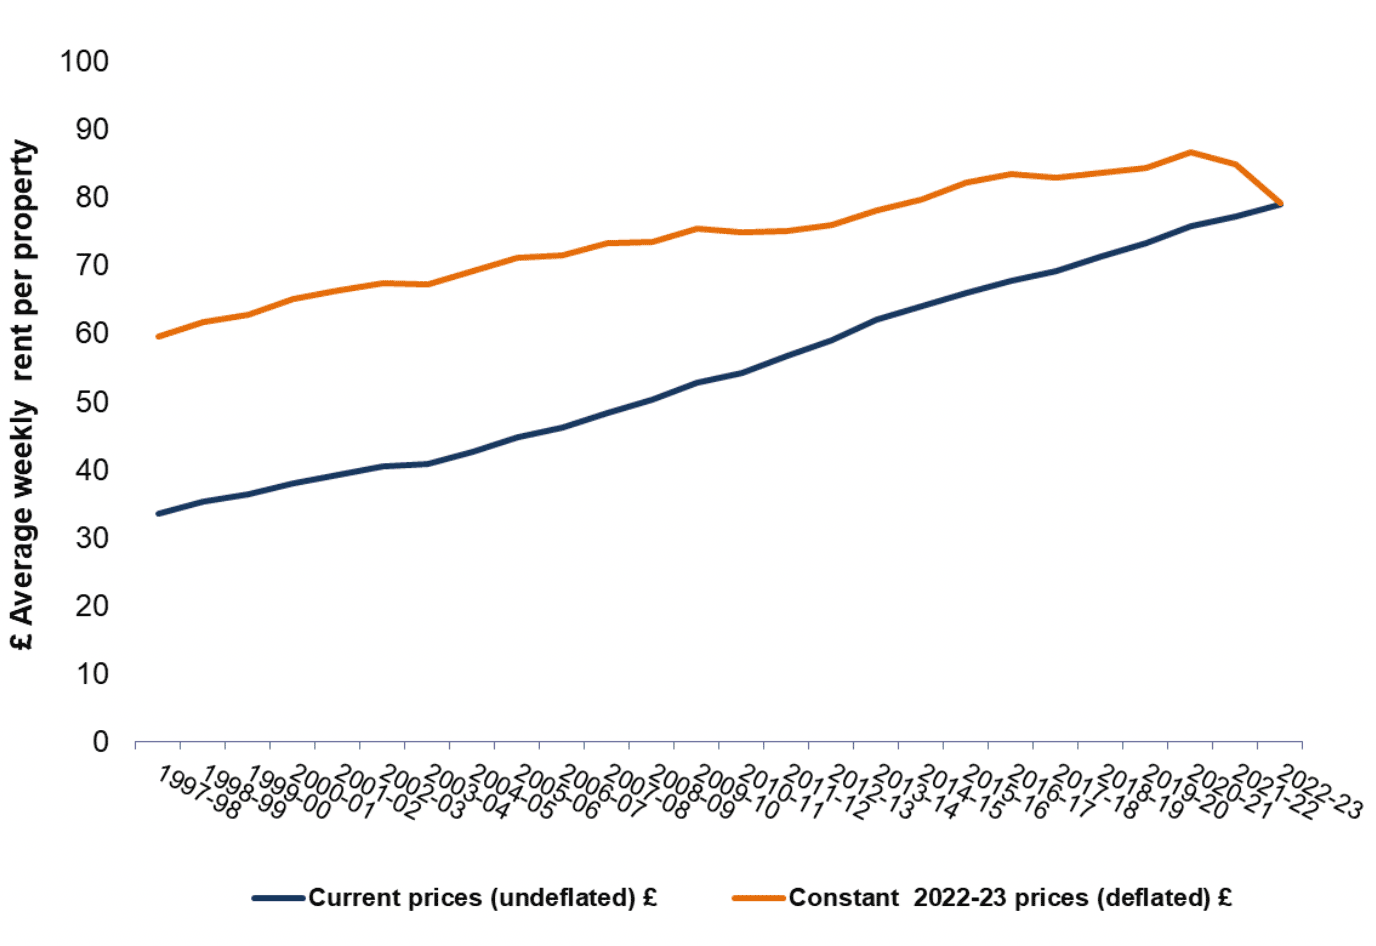
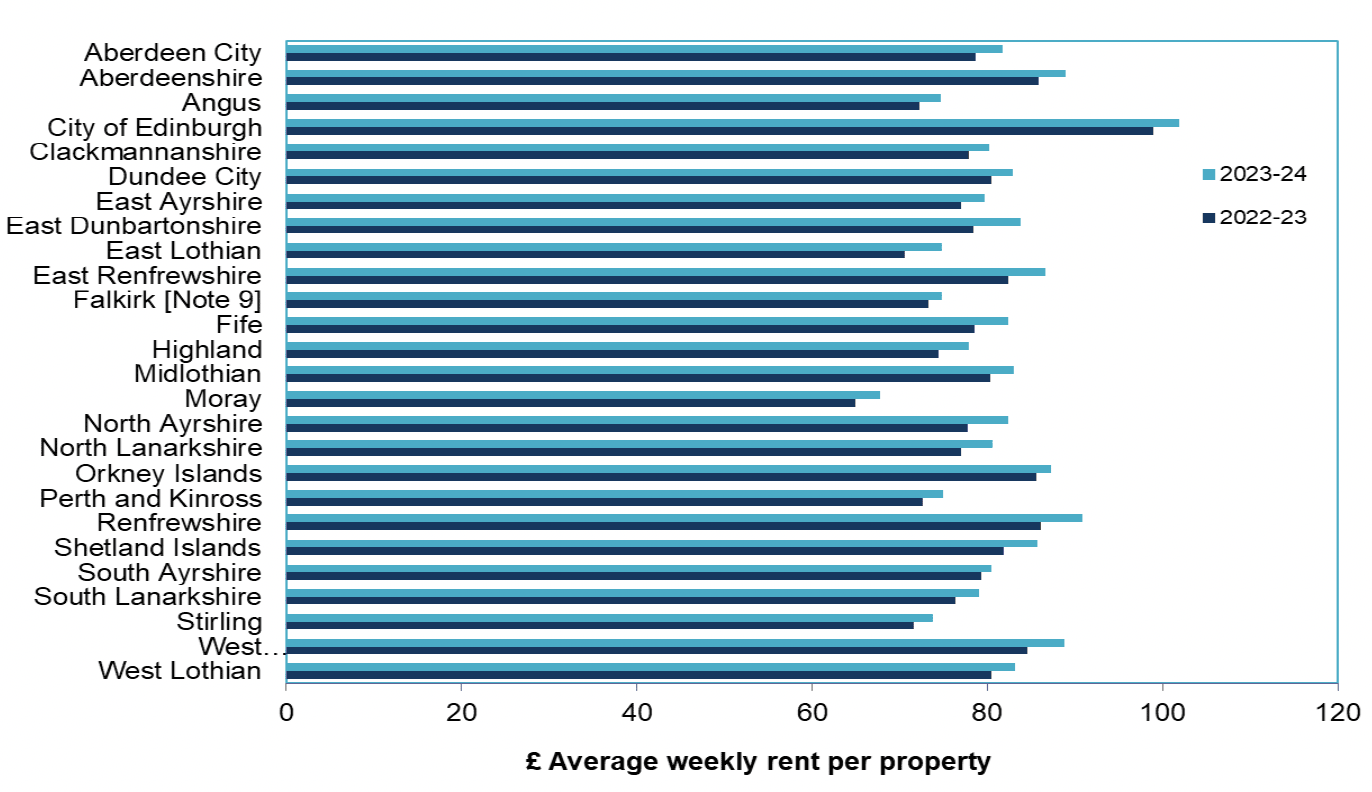
5.2 The average rent per dwelling (including both let and un-let properties) was £79.07 per week in 2022-23, an increase of £1.86 since 2021-22. In 2022-23 there is variation between councils in average rents, from £64.92 per week in Moray to £98.92 per week in the City of Edinburgh. As this rent data includes un-let houses the actual amount of rent paid by tenants is likely to be slightly higher.
5.3 These figures may be lower than rents reported in other publications, for example, the rent figures produced by the Scottish Housing Regulator as rather than taking a weighted average of set rents charged to tenants, they instead reflect the amount earned by the council in respect of each property owned (calculated by dividing the Council's Standard Rental Income on houses by the total letting stock). This method considers the proportion of housing which spends some time un-let and those for which rent is not successfully collected.
5.4 Housing benefits accounted for a high proportion of council rental income. In 2022-23, rent rebate subsidy for council house tenants was £428m, representing 33% of total income from standard rents. In 2022-23, rent rebate subsidy as a proportion of standard rents varied from 21% in the Shetland Islands to 64% in South Ayrshire.
Contact
Email: chma@gov.scot
There is a problem
Thanks for your feedback