Housing Revenue Account (HRA) Statistics: Scottish Local Authority Housing Income and Expenditure 1997-98 to 2022-23 (near actuals) & 2023-24 (budgeted estimates)
This official statistics publication reports council housing income and expenditure. Trends are 1997-98 to 2022-23 (near actuals) to 2023-24 (budgeted estimates).
This document is part of a collection
6. Expenditure on housing management and on repairs and maintenance (charts 5, 6, 7) (tables 10, 11, 12)
6.1 In 2022-23 councils spent on average £2,567 per house on management and maintenance, which is forecast to fall by 0.9% to £2,545 in 2023-24. As reported earlier, some councils reported that the Pandemic has affected repairs and maintenance.
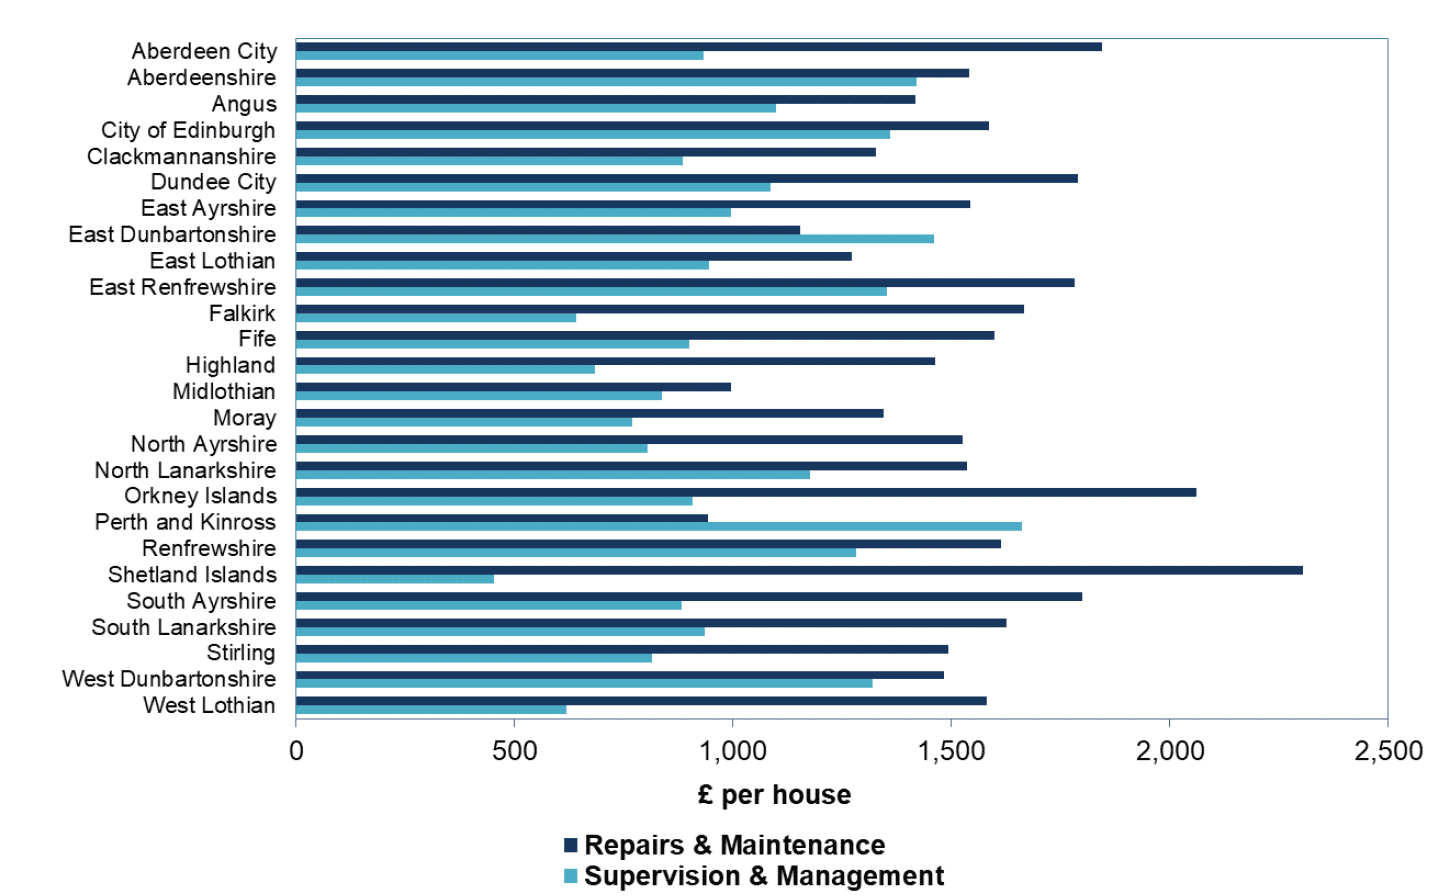
6.2 Spending on management and maintenance for 2022-23 ranges from £1,831 per house in Midlothian to £3,209 in East Renfrewshire. This reflects differing service provision amongst councils.
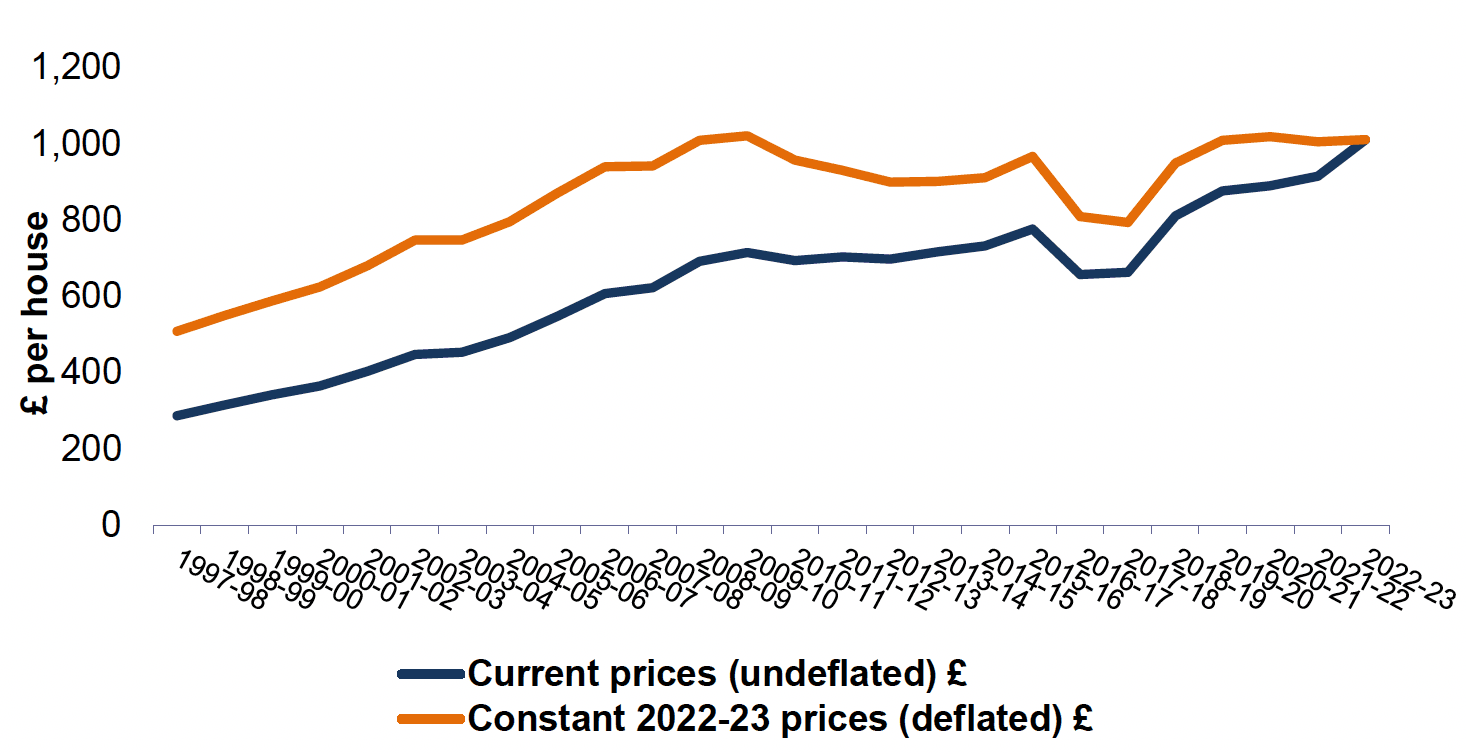
6.3 Supervision and management costs in 2022-23 were, on average, £1,011 per house and are forecast to increase to £1,058 per house in 2023-24. As councils differ in the extent to which central administration and related service costs are included, individual figures may not always be directly comparable.
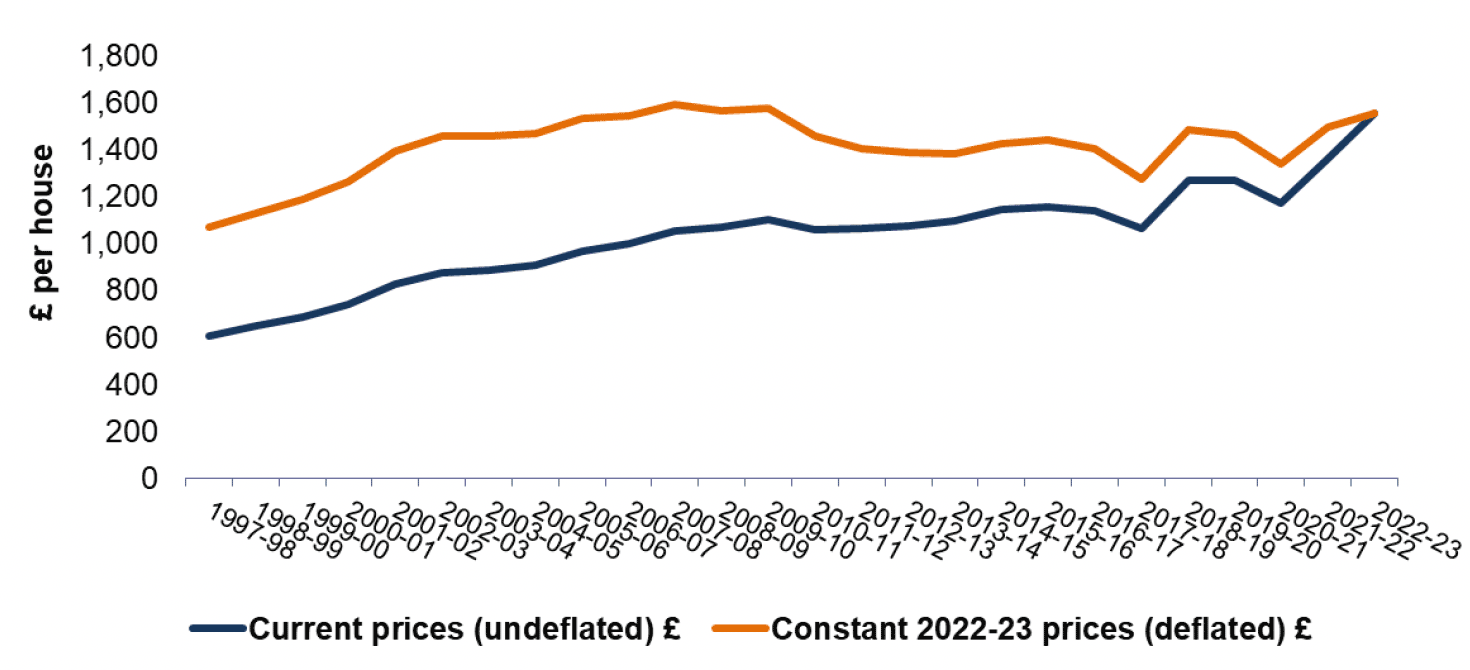
6.4 Average annual expenditure on repairs and maintenance was £1,556 per house in 2022-23 and is forecast to decrease to £1,486 or -4.5% per house in 2023-24. Spending on repairs and maintenance in 2022-23 ranges from £943 per house in Perth and Kinross to £2,305 per house in the Shetland Islands.
6.5 Please note that the HRA repairs and maintenance expenditure referred to in the above paragraphs is separate, and in additional to, the capital investment in council housing stock enhancements referred to elsewhere in this statistical publication.
Contact
Email: chma@gov.scot
There is a problem
Thanks for your feedback