Scottish Natural Capital Accounts: 2023
This report estimates quantity and value of services supplied by Scotland's natural capital.
5. Provisioning services
Provisioning services are products extracted, harvested or derived from nature, such as food, water, energy and materials. These include:
- agricultural biomass - the value of crops, fodder, and grazing (while farmed animals are not included as they are considered produced rather than natural assets, the food these animals eat, such as grass and feed, is included)
- water abstraction - water removal for public water supplies
- fossil fuels extraction - production of crude oil, gas, and coal
- renewable energy generation - electricity generated from renewable sources (wind, hydroelectric, solar, wave, and tidal)
- timber removals - wood production (also referred to as removals) is the harvesting of roundwood (trunks and branches) from coniferous (softwood) and broadleaved (hardwood) trees
- mineral extraction - largely consisting of construction mineral aggregates
- fish capture - the value of marine fish taken from Scottish waters (aquaculture of farmed fish is excluded as these are viewed as produced rather than natural assets)
In 2019, the annual value of provisioning services in Scotland was £14 billion, 57% of the annual value of provisioning services across the UK. Generally, the value of provisioning services is determined by the extent and location of underlying natural capital assets rather than where the people that ultimately benefit from these assets are based.
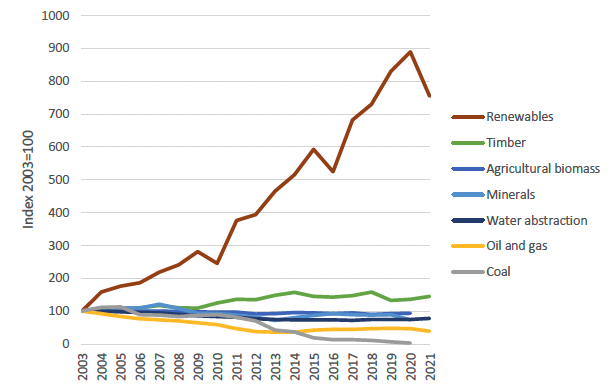
Physical index values of each provisioning service, Index 2003=100, 2003 to 2021
Source: UK natural capital accounts from the Office for National Statistics
Notes:
1. Data for fish capture is only available from 2014 and so is excluded.
2. Data for agricultural biomass and coal is only available up to 2020.

Annual values of each provisioning service in Scotland and the rest of the UK, £ million (2021 prices), 2019
Sources: Department for Business, Energy and Industrial Strategy, Scientific, Technical and Economic Committee for Fisheries, Seafish, Marine and Management Organisation, British Geological Survey, Forest Research and Department for Environment, Food and Rural Affairs
Fossil fuels
Fossil fuel production covers the extraction and sale of oil, gas and coal reserves.
The physical production of fossil fuels has declined markedly, with output down 53% for oil and gas and 97% for coal between 2003 and 2020.
Even so, oil and gas was the highest-value provisioning service in 2019, estimated at £12 billion, 86% of total provisioning services in Scotland, and more than 99% of the total UK oil and gas value.
Changes in the annual value of the fossil fuel services are driven more by fluctuations in the parameters used in the resource rent method than changes in the industries' physical output. See more information in our Scotland natural capital accounts methodology: 2023.
Fish capture
Fish capture refers to marine fish taken from Scottish waters. Farmed fish, or aquaculture, is excluded from this value, as these are considered produced, rather than natural asset.
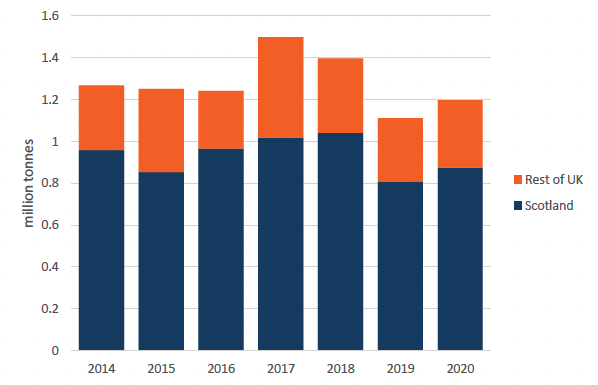
Fish capture for Scotland and the rest of UK, million tonnes, 2014 to 2020
Sources: UK natural capital accounts from the Office for National Statistics, Scientific, Technical and Economic Committee for Fisheries, Seafish, Marine and Management Organisation
Some 73% of the total UK fish capture in 2020 was in Scotland (Figure 5), but this proportion was greater for certain fish species. The top 10 species caught in Scotland represented 90% of the total UK catch. Atlantic mackerel accounted for an average of 35% of all fish caught in Scotland's waters over the last five years. While 238 different species of fish were caught in Scotland's waters between 2015 to 2020, Atlantic mackerel (35%) and herring (29%) made up 64% of total catches over this period.
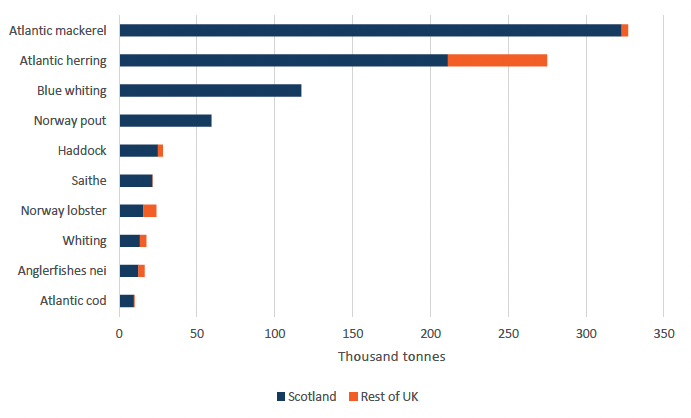
Top ten fish species caught in Scotland's waters compared with the rest of the UK, thousand tonnes, 2020
Sources: UK natural capital accounts from the Office for National Statistics, Scientific, Technical and Economic Committee for Fisheries, Seafish, Marine and Management Organisation
In the natural capital accounts, fishing pressure for each stock is checked against the maximum sustainable yield, as can be seen in the International Council for the Exploration of the Sea's stock assessment graphs. We also check whether each species' reproductive fish stock is at or above the level capable of producing the maximum sustainable yield.
This approach does not consider the knock-on effects of unsustainable fishing to the ecosystem. For instance, if a fish species which forms a significant part of other fish species' diets is managed unsustainably, it may affect the sustainability of other fish stocks higher up the food chain.
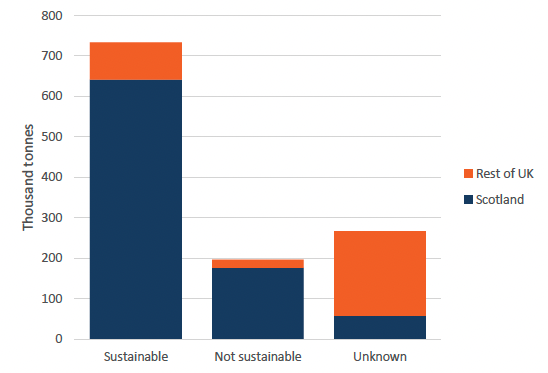
Sustainability of fish capture in Scotland compared with rest of UK, thousand tonnes, 2020
Sources: UK natural capital accounts from the Office for National Statistics, Scientific, Technical and Economic Committee for Fisheries, Seafish, Marine and Management Organisation
In 2020, 73% of fish capture tonnage in Scotland was categorised as sustainable, while 20% was categorised as unsustainable, and the sustainability status was unknown for 7%. In the rest of the UK, 65% of total capture had an unknown sustainability status. The share of fish caught in Scotland's waters for which the sustainability status is known is higher than for the UK as a whole. This is mainly because the top 10 catches in Scotland in 2020, which accounted for 92% of total Scottish fish capture, all had a known sustainability status.
Agricultural biomass
Agricultural biomass relates to the value of crops, fodder and grazed biomass provided to support agricultural production in Scotland.
Physical production of agricultural biomass decreased by 6% between 2003 and 2020, mostly driven by a 39% drop in grazed biomass, which on average constituted 27% of total production across this period. At the same time, the annual value of biomass increased from £407 million in 2003 to £706 million in 2019, largely because of increases in the industry's gross operating surplus.
Renewables
Renewable energy generation refers to electricity generated from renewable sources, dependent on the natural services of wind, sunshine, tides and rainfall, through offshore and onshore wind turbines, hydroelectric plants and solar panels.
Total renewable energy generation in Scotland was more than three times greater in 2021 than in 2008, increasing 213% from 8,062 gigawatt hours (GWh) in 2008 to 25,260 GWh in 2021. In comparison, energy generation from oil and gas fell by 60% from 13,126 GWh to 5,261 GWh over the same period.
The percentage of total energy generation in Scotland which comes from renewable sources has increased considerably, from 16% in 2008 to 52% in 2020.
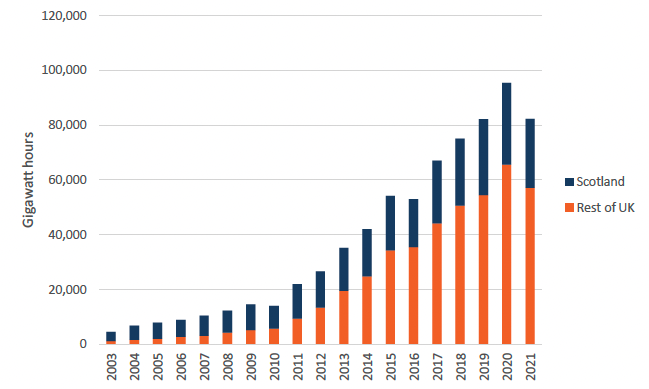
Total electricity generation from renewables, Scotland and the rest of UK, gigawatt hours, 2003 to 2021
Sources: UK natural capital accounts from the Office for National Statistics and Department for Business, Energy and Industrial Strategy
Between 2020 and 2021 renewable energy generation decreased by 15%, with onshore wind and hydro showing the largest decreases of 22% and 21% respectively.
In 2021, the largest share of renewable energy generation in Scotland was from onshore wind at 68% (Figure 9). Scotland produces 31% of the UK total wind electricity generation and 86% of Scotland's contribution comes from onshore wind.
The composition of renewable energy generation in Scotland has also changed. In 2008, hydro accounted for 58% and wind 41%, by 2021 hydro accounted for 20% and wind 79%.
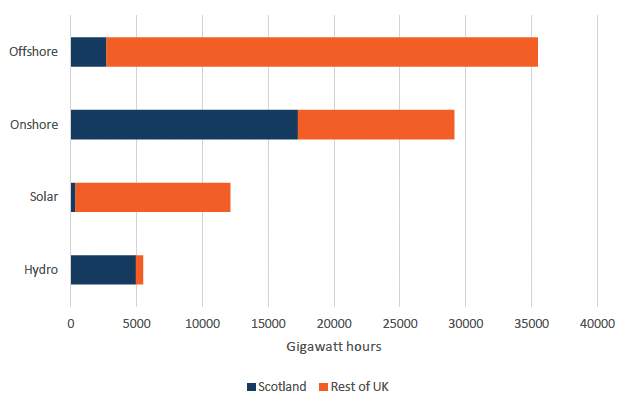
Total electricity generated by different renewable technologies in Scotland and the rest of UK, gigawatt hours, 2021
Sources: UK natural capital accounts from the Office for National Statistics and Department for Business, Energy and Industrial Strategy
Timber
Timber removals refer to the harvesting of roundwood (trunks and branches) from coniferous and broadleaved trees. Our data cover softwood, from coniferous trees such as spruce, pine and larch, and hardwood, from non-coniferous trees such as oak, birch and beech, from both private and public sources.
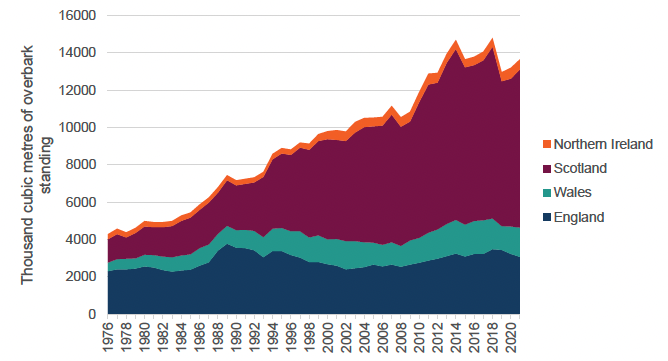
Timber removals for each region of the UK, thousand cubic metres overbark standing, 1976 to 2021
Sources: UK natural capital accounts from the Office for National Statistics and Forest Research
UK timber removal has increased since 1976, largely driven by removals in Scotland. Between 1976 and 2021, timber production in Scotland increased nearly sixfold, by 7,217 thousand cubic metres. However, during this period there were some annual reductions in production, notably in 2019 which saw a 16% decrease.
Water abstraction
Water abstraction decreased 28% between 2003 to 2017, from 915 million cubic metres to 662 million cubic metres. This was partly because of a decrease in water leakage, with the three-year moving average declining every year since 2005. Over the four years to 2021, there has been a 4% increase in water abstraction.

Water abstraction and water leakage, million cubic metres, Scotland, 2003 to 2021
Source: Scottish Water
Notes:
1. Data for water leakages are for financial years.
2. Water leakage data is on a 3-year moving average basis. This aligns with Ofwat targets/reporting and helps to reduce sensitivity to anomalous events such as weather conditions.
Contact
There is a problem
Thanks for your feedback