Scottish Natural Capital Accounts: 2023
This report estimates quantity and value of services supplied by Scotland's natural capital.
6. Regulating services
Regulating services help to maintain the quality of the environment we rely upon, from the regulation of natural processes such as air quality regulation, climate regulation and natural hazard regulation. For Scotland, these include:
- sequestering and storing of climate change-causing greenhouse gases (GHGs) - a range of habitats, particularly woodlands, enable the removal of GHGs, mostly carbon dioxide (CO2), from the atmosphere
- removing air pollutants - the removal of air pollutants by vegetation, the monetary value of which is measured in terms of the willingness to pay to avoid hospitalisation and early mortality
- urban cooling - green (for example, parks) and blue (rivers, lakes, and canals) spaces can cool urban environments on hot days; benefits include limiting loss of labour productivity and reducing air conditioning use
- mitigating noise - vegetation acts as a buffer against noise pollution such as from road traffic
In 2019, the annual value of regulating services in Scotland was negative £498 million.
As with the rest of the UK, land use in Scotland results in net emissions of GHGs, which generates negative flow and asset values for this ecosystem service. Scotland accounted for 46% (2,724 thousand tonnes of CO2 equivalent) of net carbon emissions from land use in the UK in 2019, proportionally higher than the 32% of UK land area situated in Scotland.
These emissions are particularly high in areas with degraded peatland, since this emits carbon that has been stored up over centuries. Scotland has 66% of UK peatlands, and with 25% of Scotland's peatlands in a near-natural or rewetted condition, the share of net land emissions is also large. However, woodlands in Scotland have consistently removed more GHGs than they emit, and as such are valued at £1.5 billion in 2019.
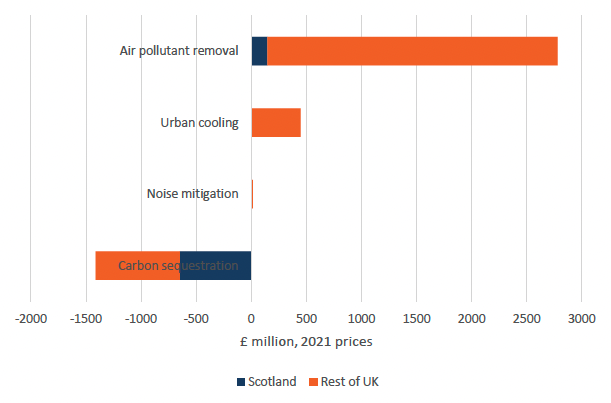
Annual values of each regulating service in Scotland and the rest of the UK, £ million (2021 prices), 2019
Sources: UK natural capital accounts from the Office for National Statistics
Air pollution removal
The annual value of air pollution removal by nature was £145 million in Scotland in 2019. As this is estimated through avoided health impacts, values are driven by the number of people benefitting from this service.
The largest amount of pollutant removed by physical volume is ozone (Figure 13), however this accounts for a low proportion of the total annual value of air pollution removal, 6% in 2020.
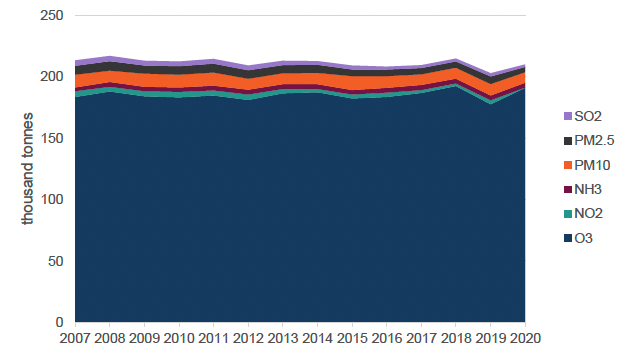
Air pollution removal by pollutant, thousand tonnes, in Scotland, 2007 to 2020
Sources: UK natural capital accounts from the Office for National Statistics and the UK Centre for Ecology and Hydrology
Notes:
1. Pollutants considered include ozone (O3), nitrogen dioxide (NO2), ammonia (NH3), particulate matter 10 and 2.5 (PM10 and PM2.5), and sulphur dioxide (SO2)
Although a relatively small physical volume of particulate matter 2.5 (PM2.5, a fine particulate matter with a diameter of 2.5 micrometres or less) air pollution is removed by nature, it has consistently accounted for the greatest share of the annual value in Scotland, representing 85% of the total in 2020.
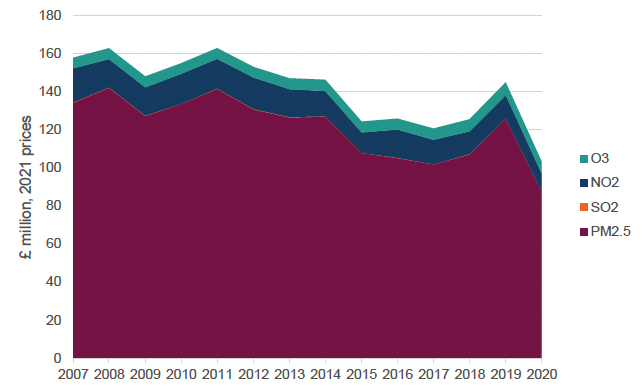
Annual value of each pollutant removed in Scotland, £ million (2021 prices), 2007 to 2020
Sources: UK natural capital accounts from the Office for National Statistics and the UK Centre for Ecology and Hydrology
Notes:
1. The negative health effects of PM10 and NH3 are captured under PM2.5 estimates
2. Pollutants considered include ozone (O3), nitrogen dioxide (NO2), ammonia (NH3), particulate matter 10 and 2.5 (PM10 and PM2.5), and sulphur dioxide (SO2)
The biggest impact of particulate air pollution on public health is from long-term exposure to PM2.5, which increases the age-specific mortality risk, particularly from cardiovascular and respiratory diseases. This pollutant is emitted from multiple sources including wood and coal stoves, and wear of tyres and brakes. See more information in the Department for the Environment, Food and Rural Affairs Assessing progress towards WHO guideline levels of PM2.5 in the UK (PDF, 210KB).
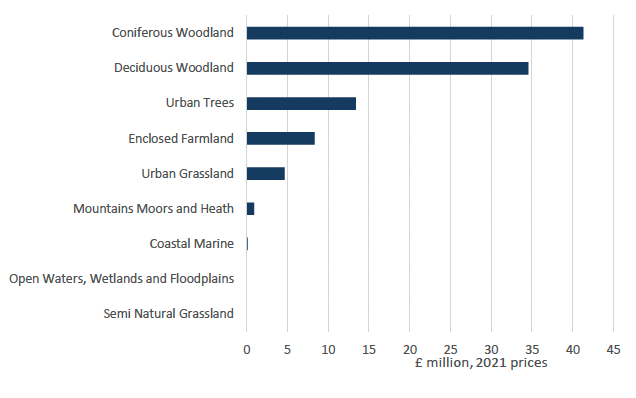
Annual value of air pollution removal by habitat, £ million (2021 prices), Scotland, 2020
Sources: UK natural capital accounts from the Office for National Statistics and the UK Centre for Ecology and Hydrology
Coniferous woodlands provide the highest value in removing air pollution in Scotland (Figure 15). This is partly because of the extent of this habitat, covering 12% of Scotland's land area compared with 6% across the UK, but also the relative efficiency of woodlands in pollution removal compared with other habitat types. Trees and woodland habitats accounted for 86% of the total of air pollution removal service value in Scotland in 2020.
Densely populated local authority areas typically generate the greatest air pollution removal values because of the number of people benefitting being considerably higher than in more sparsely populated areas, despite comparatively lower levels of vegetation. Urban trees and grasslands have the highest value per square kilometre because of their proximity to urban populations.
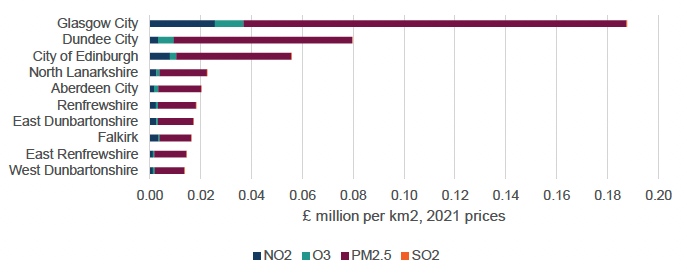
Top ten local authorities in Scotland, air pollution removal value, £ million per km2, 2020
Sources: UK natural capital accounts from the Office for National Statistics and the UK Centre for Ecology and Hydrology
Of the UK's physical pollutant removal, 23% occurred in Scotland. This is because of the relative abundance of green vegetation in Scotland. However, because of the population size and geographical distribution, this translated into 4% of the UK's total annual value.
Urban cooling
Nature has a cooling effect in urban environments, avoiding labour productivity losses therefore benefitting the economy, and reducing the use of artificial cooling such as air conditioning.
Urban cooling services were valued at £4 million in 2019. Woodlands contributed the greatest amount in temperature regulation, reducing the average temperature by 0.35 degrees Celsius in Edinburgh and Glasgow. The benefit from improved labour productivity makes up most of the value, with avoided air conditioning energy costs accounting for a small fraction.
Noise mitigation
Nature can act as a buffer against noise pollution, in particular road traffic noise. Noise pollution causes adverse health outcomes through sleep disturbance, hypertension and annoyance. The economic value is estimated through avoided loss of quality adjusted life years (QALY) using the Department for Environment, Food and Rural Affairs' (Defra's) marginal noise damage cost values.
The total number of buildings in Scotland that benefitted from a reduction in noise in 2019 was 7,000, with an estimated £664,506 annual value and £36 million in asset value.
Contact
There is a problem
Thanks for your feedback