Scottish Housing Market Review: Q2 2023
Quarterly bulletin collating a range of statistics on the Scottish housing market, such as house prices and transactions, rental trends, cost and availability of finance, etc.
This document is part of a collection
1. Sales
Scottish Sales Performance: National
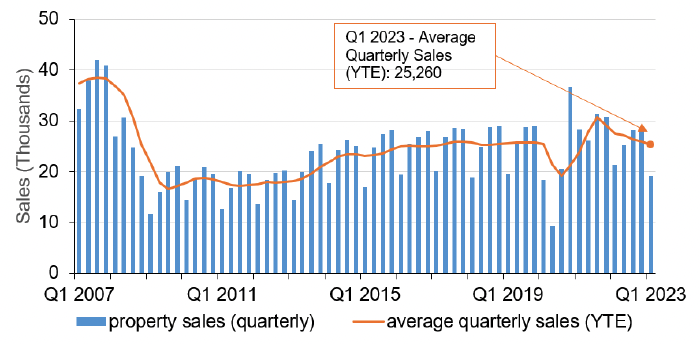
* Number of sales between £20,000 and £1 million. Source: Registers of Scotland
After considerable volatility due to the impact of the Covid-19 pandemic, as well as measures such as the temporary reduction in Land Buildings Transaction Tax (LBTT), transactions stabilised close to pre-pandemic levels. More recently, transactions have begun to slow, with Registers of Scotland statistics showing that there were 19,119 residential property sales registered across Scotland in Q1 2023. Relative to Q1 2022 this was a decrease of 10.6%; relative to the pre-pandemic average for Q1 (2016 - 2019), the number of transactions decreased by 1.9%.
Data from Revenue Scotland also indicates that there has been a reduction in housing market activity in Scotland. Chart 1.2 plots the percentage difference between monthly residential LBTT returns over the period 2020 to 2023 relative to the corresponding month in 2019, with 2019 chosen as the baseline to reflect pre-Covid market conditions. While it can be seen that for much of the latter half of 2022, transactions closely tracked their levels in 2019, the number of transactions since December 2022 has generally been lower than the comparable month before the pandemic, with transactions over the 5-month period from January to May 2023 9.4% below the corresponding months in 2019. The increase in mortgage rates (see Section 6) is likely to have contributed to this decline.
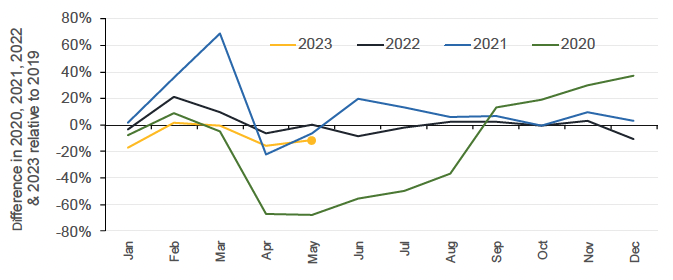
Source: Revenue Scotland
Scottish Sales Performance: Regional
Registers of Scotland data shows that the number of residential property sales in Q1 2023 was lower than Q1 2022 not only for Scotland as a whole, but also in each region. The largest decreases in residential property sales were in Argyll & Bute and Highlands & Islands (-18.8%) and Aberdeen/shire & Moray (-17.5%), whilst the smallest decline (-7.2%) was in the Forth Valley.
Analysing the annual change using a rolling four quarters method, it can be seen that the decrease in transactions of 7.9% at the national level for the one year period to Q1 2023 relative to the year prior has also been experienced across Scottish regions. The largest fall in residential property sales over this time period was in Argyle & Bute and Highland & Islands (-11.6%), whilst the smallest decrease was in Forth Valley (-3.2%).
A summary of residential property sales activity by Scottish region is outlined in Table 1.1 below. This contains the number of residential property sales registered in Q1 2023, the annual change, as well as the annual change in sales using a rolling four quarter period to Q1 2023. The latter is included to smooth out volatility in quarterly data.
Table 1.1 Regional residential transactions
Aberdeen/shire and Moray
Sales – Q1 2023 1,843
12 Month Change -17.5%
Annual change (rolling 4 quarters) -9.3%
Edinburgh, Lothians and Borders
Sales – Q1 2023 3,843
12 Month Change -10.7%
Annual change (rolling 4 quarters) -7.1%
Argyll & Bute and Highland & Islands
Sales – Q1 2023 1,268
12 Month Change -18.8%
Annual change (rolling 4 quarters) -11.6%
Forth Valley
Sales – Q1 2023 1,046
12 Month Change -7.2%
Annual change (rolling 4 quarters) -3.2%
Ayrshires and Dumfries & Galloway
Sales – Q1 2023 1,782
12 Month Change -8.7%
Annual change (rolling 4 quarters) -7.4%
Tayside & Fife
Sales – Q1 2023 2,764
12 Month Change -7.8%
Annual change (rolling 4 quarters) -9.1%
Clyde Valley
Sales – Q1 2023 6,573
12 Month Change -8.8%
Annual change (rolling 4 quarters) -7.6%
Scotland
Sales – Q4 2022 19,119
12 Month Change -10.6%
Annual change (rolling 4 quarters) -7.9%
Source: Registers of Scotland
Contact
Email: jake.forsyth@gov.scot
There is a problem
Thanks for your feedback