Scottish Housing Market Review: Q2 2023
Quarterly bulletin collating a range of statistics on the Scottish housing market, such as house prices and transactions, rental trends, cost and availability of finance, etc.
This document is part of a collection
6. Mortgage Interest Rates
In March 2020, the Bank Rate was cut by a total of 65 basis points to 0.1% as a result of the Covid-19 pandemic. More recently in response to the rise in inflation, the Bank of England has increased the bank rate thirteen times since December 2021, most recently by 25 basis points in May 2023 and by 50 basis points in June 2023. Since December 2021, the Bank Rate has increased by 490 basis points to 5.00%, its highest level since 2008.
Chart 6.1 and Chart 6.2 show data on the effective (or average) interest rates on outstanding mortgage balances and new mortgage advances. (Source: BoE). From December 2021 to May 2023, increases in mortgage rates have been below the increase in Bank Rate: compared to a cumulative 440 basis point increase in the Bank Rate over this period: the average variable rate on outstanding mortgages increased by 379 basis points to 6.12%, the average variable rate on new advances by 343 basis points to 5.11%, and the average fixed rate on new advances increased by 298 basis points to 4.47%. The average fixed rate on outstanding mortgages has started to increase, albeit by only 40 basis points since December 2021, to 2.35% as at May 2023 – due to the large share of mortgages on fixed rates (see Chart 6.4), most of which are two- and five-year fixes, it takes some time before outstanding mortgages are affected by the increase in interest rates.
Effective Monthly Mortgage Interest Rates (Monthly), UK
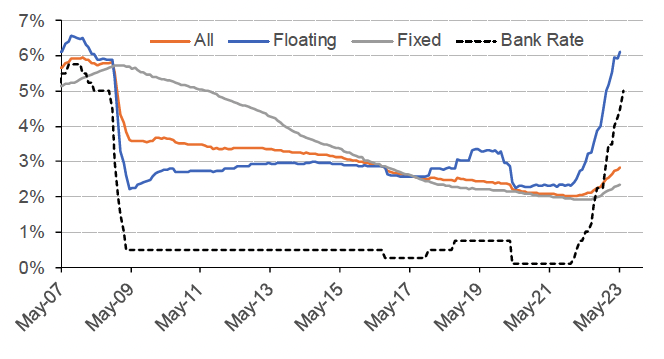
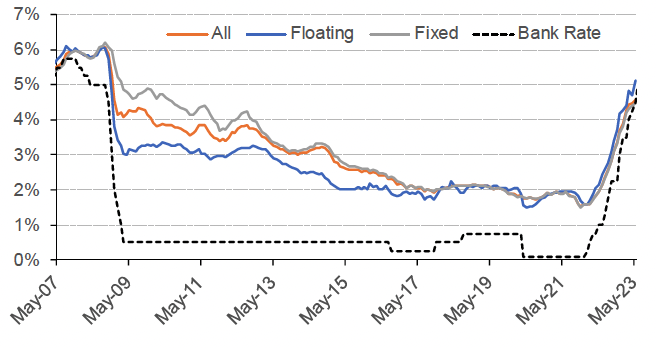
Source: Bank of England
More recent data indicates that mortgage interest rates continued increasing in June and into July. Following the 50 basis point increase in the Bank Rate at the Monetary Policy Meeting on 21 June, the average rate on advertised two-year fixed-rate mortgages increased to 6.47% on 4 July, relative to 5.49% on 1 June. Meanwhile the average rate on advertised five-year fixed-rate mortgages increased from 5.17% on 1 June to 6.01% on 4 July. The fact that five-year fixes are at lower rates than two-year fixes reflects market expectations that interest rates will moderate over the medium term. (Source: Moneyfacts press release; note that this data refers to the average of advertised rates, rather than of interest actually paid, and is therefore calculated on a somewhat different basis to the data in Chart 6.1 and Chart 6.2)
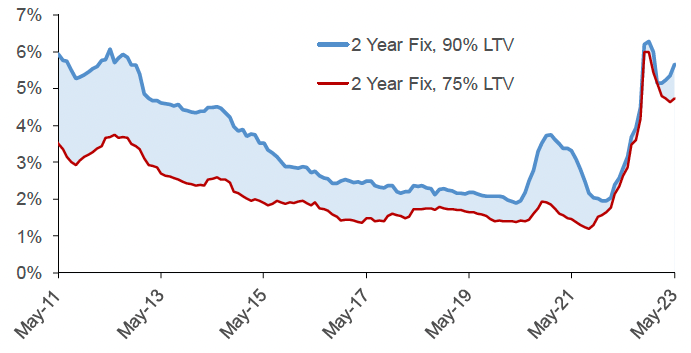
As shown in Chart 6.3, the spread between the average advertised rate on two-year fixed-rate 90% and 75% LTV mortgages was elevated during the pandemic and peaked in December and April 2020 at 189 basis points. After that the spread reduced virtually to zero by January 2023, although since then the spread has widened to 93 basis points in May 2023. (Source: BoE).
Source: Bank of England
Chart 6.4 shows that the vast majority of regulated[1] mortgages are on fixed rates, with 83.1% of new mortgages and 86.9% of outstanding mortgages on fixed rates as of Q1 2023. The corresponding figures for unregulated[2] mortgages are 83.0% and 77.6%. (Source: FCA). However, following a period of sustained increase, there was a sharp drop in the share of new mortgages on fixed rates in Q1 2023.
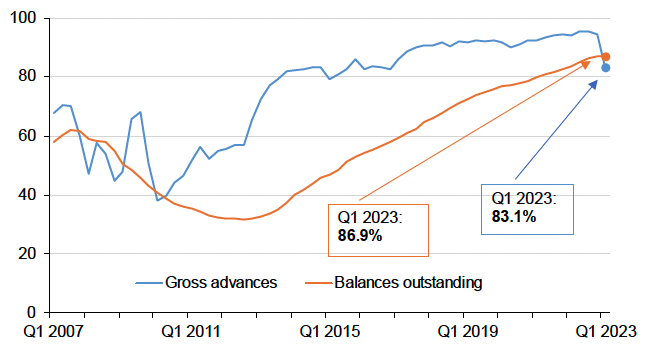
Source: FCA Mortgage Affordability
Contact
Email: jake.forsyth@gov.scot
There is a problem
Thanks for your feedback