Scottish Housing Market Review Q3 2023
Quarterly bulletin collating a range of previously published statistics on the latest trends in the Scottish housing market.
This document is part of a collection
1. Sales
1.1. Scottish Sales Performance: National
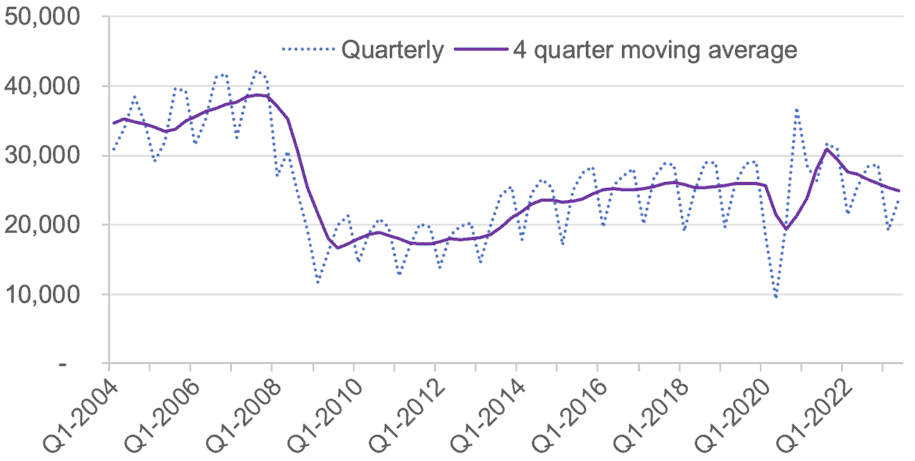
Source: Registers of Scotland
After considerable volatility due to the impact of the Covid-19 pandemic, as well as measures such as the temporary reduction in Land Buildings Transaction Tax, transactions stabilised around pre-pandemic levels. More recently, transactions have begun to slow, with Registers of Scotland statistics showing that there were 23,660 residential property sales registered across Scotland in Q2 2023. Relative to Q2 2022 this was a decrease of 6.5%; relative to Q2 2019, prior to the pandemic, the decrease was 8.9%.
More up-to-date data from Revenue Scotland confirms there has been a reduction in housing market activity in Scotland. Chart 1.2 plots the percentage difference between monthly residential LBTT returns over the period 2020 to 2023 relative to the corresponding month in 2019, with 2019 chosen as the baseline to reflect pre-covid market conditions. While it can be seen that for much of 2022, transactions closely tracked their levels in 2019, the number of transactions since December 2022 has generally been lower than before the pandemic, with transactions over the 8-month period from January to August 2023 8.8% below the corresponding months in 2019. The increase in mortgage rates (see Section 6) is likely to have contributed to this decline.
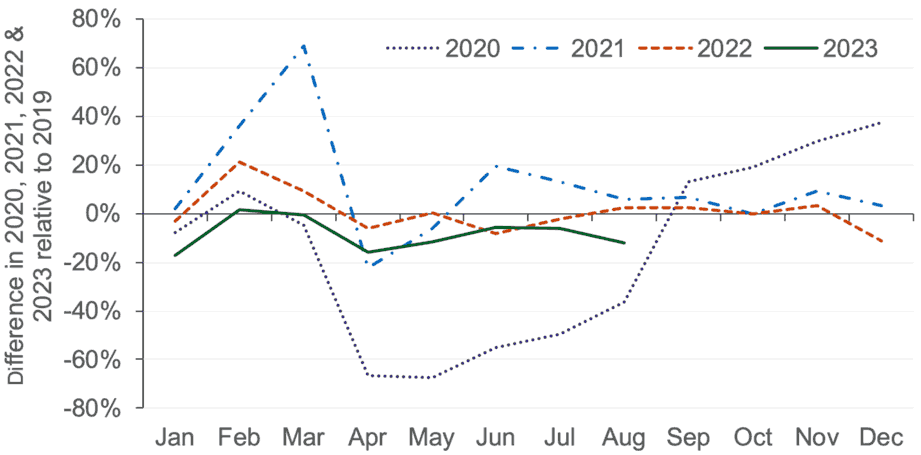
Source: Revenue Scotland
1.2. Scottish Sales Performance: Regional
As set out in Table 1.1, Registers of Scotland data shows that the 6.5% annual fall in the number of transactions at the Scotland-level in Q2 2023 was mirrored in each region with the exception of the Forth Valley, where transactions were up by 1.3%. The largest annual decrease (16.5%) was in Aberdeen/shire & Moray.
Using a rolling four-quarter average to look at longer-term trends and smooth out volatility in the quarterly data, the annual fall in transactions at the Scotland-level (of 8.7%) was experienced across all regions of Scotland. Again, the best-preforming region, which had the smallest decrease of 2.9%, as the Forth Valley, while the worst-performing region was Aberdeen/shire & Moray, which recorded a decrease of 15.0%.
Table 1.1 Regional residential transactions
Aberdeen/shire and Moray
Sales – Q2 2023 2,460
12 Month Change -16.5%
Annual change (rolling 4
quarters) -15.0%
Edinburgh, Lothians and Borders
Sales – Q2 2023 4,721
12 Month Change -8.0%
Annual change (rolling
4 quarters) -9.0%
Argyll & Bute and Highland & Islands
Sales – Q2 2023 1,594
12 Month Change -4.4%
Annual change (rolling
4 quarters) -11.1%
Forth Valley
Sales – Q2 2023 1,316
12 Month Change 1.3%
Annual change (rolling 4
quarters) -2.9%
Ayrshires and Dumfries & Galloway
Sales – Q2 2023 2,312
12 Month Change -0.4%
Annual change (rolling
4 quarters) -6.3%
Tayside & Fife
Sales – Q2 2023 3,437
12 Month Change -5.1%
Annual change (rolling
4 quarters) -8.3%
Clyde Valley
Sales – Q2 2023 7,820
12 Month Change -5.9%
Annual change (rolling
4 quarters) -7.6%
Scotland
Sales – Q2 2023 23,660
12 Month Change -6.5%
Annual change (rolling
4 quarters) -8.7%
Source: Registers of Scotland
Contact
Email: Bruce.Teubes@gov.scot
There is a problem
Thanks for your feedback