Scottish Housing Market Review Q3 2023
Quarterly bulletin collating a range of previously published statistics on the latest trends in the Scottish housing market.
This document is part of a collection
5. Mortgage Approvals & LTVs
5.1. New Mortgage Advances
Chart 5.1 plots the number of new mortgages advanced to first-time buyers and home movers in Scotland. There were 7,210 new mortgages advanced to first-time buyers in Scotland in Q2 2023, an annual decrease of 9.6% (770 loans). Meanwhile, there were 7,020 new mortgages advanced to home movers in Scotland in Q2 2023, an annual decrease of 11.8% (940 loans). Comparing the 4-quarter period to Q2 2023 against the previous 4 quarters, new mortgage advances to first-time buyers decreased by 14.1% whilst for home movers they decreased by 9.8%. Comparing to the 4 quarters to Q2 2019, prior to the pandemic, the decrease in new mortgages to first-time buyers (13.2%) was slightly larger than the decrease for home movers (12.0%). (Source: UK Finance).
These trends are likely to reflect the impact of increase in mortgage rates (see Section 6) on activity levels in the housing market, which had previously rebounded strongly after the release of Covid-19 pandemic restrictions.
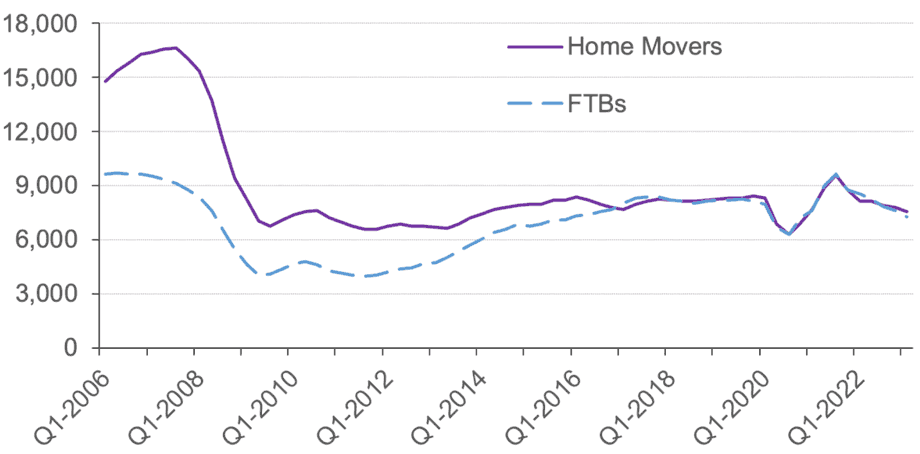
Source: UK Finance
5.2. Mortgage Approvals
Chart 5.2 plots the monthly number of mortgage approvals across the UK for house purchase by individuals. Mortgage approvals for house purchase are the firm offers of lenders to advance credit fully secured on dwellings by a first-charge mortgage. This data is a leading indicator of mortgage sales as it reflects activity early in the buying process.
Mortgage approvals across the UK rebounded strongly in the latter half of 2020 after the easing of Covid-19 restrictions, before stabilising around 2019 (pre-covid) levels in the second half of 2021 and much of 2022 (see Chart 5.2). However, in the last quarter of 2022, approvals began to fall significantly below pre-covid levels, and this trend has continued in 2023: in the first eight months of 2023, approvals are down by around a quarter (26%) relative to the corresponding period in 2019. (Source: Bank of England).
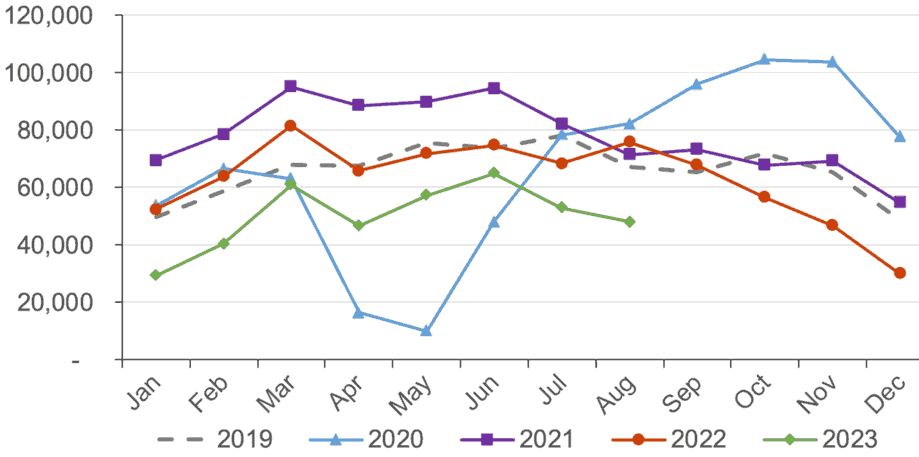
Source: Bank of England
5.3. Loan-to-Value (LTV) Ratios
In Q2 2023, the mean LTV ratio on new mortgages advanced to first-time buyers in Scotland stood at 80.6%, down by 2.8 percentage points over a one-year period. Meanwhile, the mean LTV ratio for home movers in Scotland stood at 68.7% in Q2 2023, down 4.1 percentage points over a one-year period. This is shown in Chart 5.3. (Source: UK Finance).
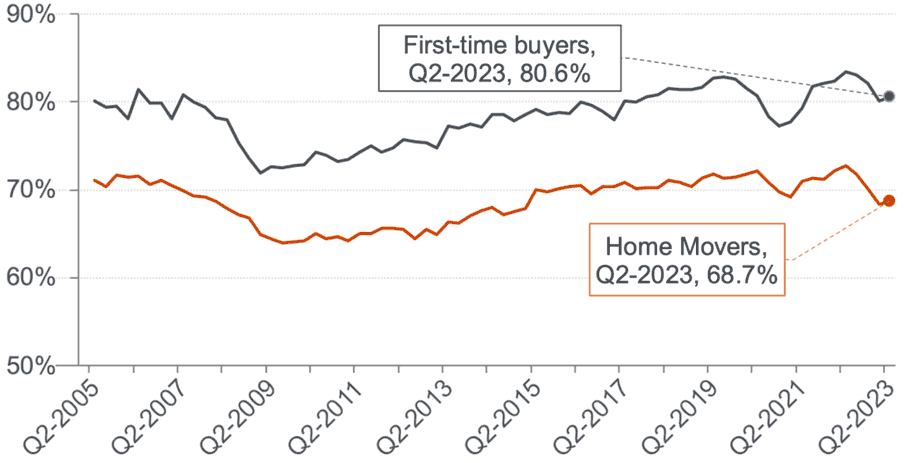
Source: UK Finance
Chart 5.4 shows that while there was a reduction in new regulated residential lending at high LTV ratios across the UK during the onset of the Covid-19 pandemic, there was a strong rebound once covid restrictions were lifted. While the recovery has stalled due to the impact of higher mortgage rates, in Q2 2023 there was a small increase in the share of all advances with an LTV greater than 90% (0.4% points) as well as in the share of all loans with an LTV greater than 90% and a high income multiple (0.2% points), although this still left them somewhat below their level a year ago (down by 0.4% and 0.7% points respectively).
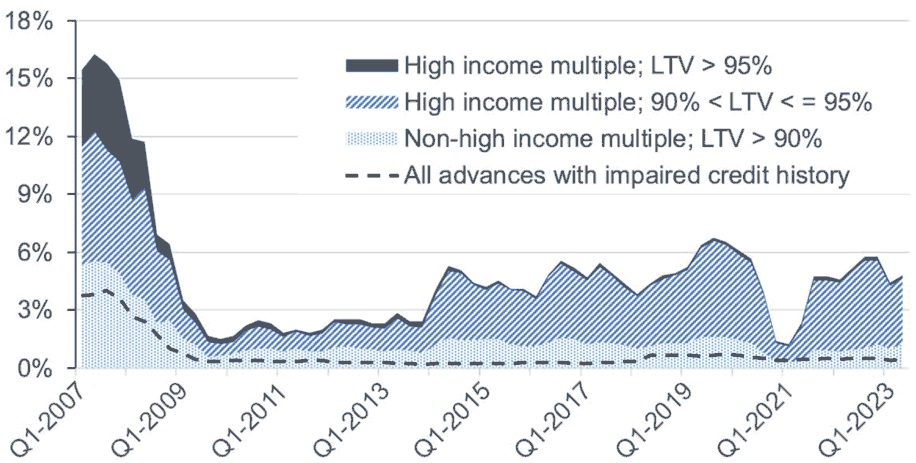
Source: FCA. Higher-risk lending is classified by the FCA as an LTV over 90% or an income multiple greater than or equal to 3.5 for single income purchasers / 2.75 for joint income purchasers.
These trends are in part the result of fluctuations in the availability of mortgage products, particularly those with higher LTVs. Following market volatility after the UK Government Plan for Growth/mini-budget on 23 September 2022, the total number of residential mortgage products fell by 42% from 3,890 on 1 September 2022 to 2,258 on 1 October 2022, while the number of residential mortgages with a maximum LTV of 95% fell by an even greater proportion (52%) from 274 to 132. Thereafter, with the exception of a small fall during December 2022, there was a steady recovery in both total and 95% LTV products over the period to 1 May 2023. (Source: Moneyfacts UK Mortgage Trends Treasury Reports).
However, after higher-than-expected CPI figures for April and May (released in May and June respectively), total products fell from 5,264 on 1 May to 4,432 on 1 July. While 95% LTV products increased during May, they then fell during June, to stand at 188 on 1 July 2023 as compared to 212 on 1 May 2023. Both total and 95% LTV products then increased during July and August. The level of total products on 1 September was 5,338, 37% higher than their level on 1 September 2022, prior to the UKG mini-budget; in contrast, despite recent increases, the level of 95% LTV products on 1 September 2023 (243) was 11% lower than a year earlier.
The volatility in the mortgage market has also been reflected in trends in the average mortgage product shelf life, which has been on a generally decreasing trend, from around approximately 40 days in the years immediately prior to Covid-19, to 28 days on 1 September 2022 prior to the UK Government mini-budget, to 15 days on 1 September 2023.
The total number of buy-to-let (BTL) mortgage products similarly fell sharply after the UK Government mini-budget, decreasing by 52% from 2,075 on 1 September 2022 to 988 on 1 October 2022. Since then, with the exception of monthly declines during May and August 2023, BTL products have recovered steadily. The total number of BTL products on 1 September 2023 was 2,475, 19% higher than a year earlier.
Contact
Email: Bruce.Teubes@gov.scot
There is a problem
Thanks for your feedback