Scottish Housing Market Review Q3 2023
Quarterly bulletin collating a range of previously published statistics on the latest trends in the Scottish housing market.
This document is part of a collection
6. Mortgage Interest Rates
In March 2020, the Bank Rate was cut by a total of 65 basis points to 0.1% as a result of the Covid-19 pandemic. More recently in response to the rise in inflation, the Bank of England has increased the Bank Rate at fourteen consecutive Monetary Policy Committee meetings beginning in December 2021, taking Bank Rate to 5.25%, its highest level since 2008. However, at their September 2023 meeting, the Monetary Policy Committee broke this trend by leaving Bank Rate unchanged.
Chart 6.1 and Chart 6.2 show data on the effective (or average) interest rates on outstanding mortgage balances and new mortgage advances. (Source: Bank of England). The increases in mortgage rates have been below the cumulative 515 basis point increase in the Bank Rate since the current tightening cycle began in December 2021. The effective floating rate on outstanding mortgages has increased by 436 basis points to 6.69% and the effective floating rate on new advances by 408 basis points to 5.76% by August 2023; the smaller increase in and lower level of rates on new advances will be partly due to customers’ being more likely to shop around when first taking out a mortgage. The effective fixed rate on new advances has increased by 325 basis points to 4.74%, while the effective fixed rate on outstanding mortgages has increased by only 61 basis to 2.56% – this is due to the most common fixes being two and five years, which means that many fixed-rate mortgages have not yet reached their end of term since rates began to rise; also, some would have reached their end of term and been refinanced at fixed rates when rates had not yet increased much. The effective rate on all outstanding balances (3.07% in August 2023) is closer to the effective rate on fixed-rate than floating-rate mortgages because of the large share of mortgages on fixed rates (see Chart 6.4).
Effective monthly interest rates on mortgage lending to households: UK (month-end, to August 2023)
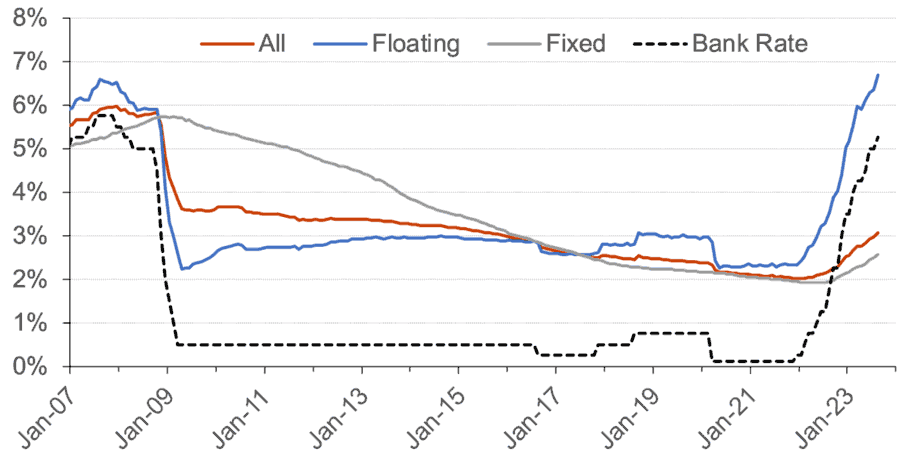
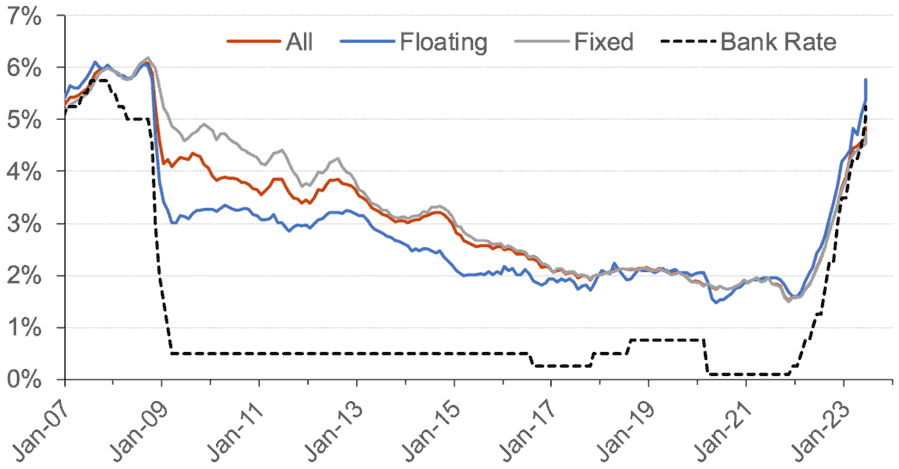
Source: Bank of England
More recent data indicates that the lower-than-expected CPI figure for August (released on 20th September) and the subsequent decision of the MPC to hold rates steady at their meeting on 21st September has led to a decrease in mortgage rates. According to Moneyfacts, the average two-year residential mortgage rate on 28th September was 6.50%, as compared to 6.70% on 1 September and 6.85% on 1 August 2023. Meanwhile, the average five rate has dipped below 6%, standing at 5.99% on 28th September, as compared to 6.19% on 1 September and 6.37% on 1 August 2023. The fact that the five-year rate is lower than the two-year rate reflects market expectations that the interest rates will moderate in the future as CPI falls back towards target. (Source: Moneyfacts press release)[1]
As shown in Chart 6.3, the spread between the average advertised rate on two-year fixed-rate 90% LTV and 75% LTV mortgages was elevated during the Covid pandemic and peaked in December 2020 and then again in April 2021 at 189 basis points. Since then, the spread has been small, standing at just 38 basis points in August 2023, significantly below the average levels that prevailed prior to the pandemic. (Source: Bank of England).
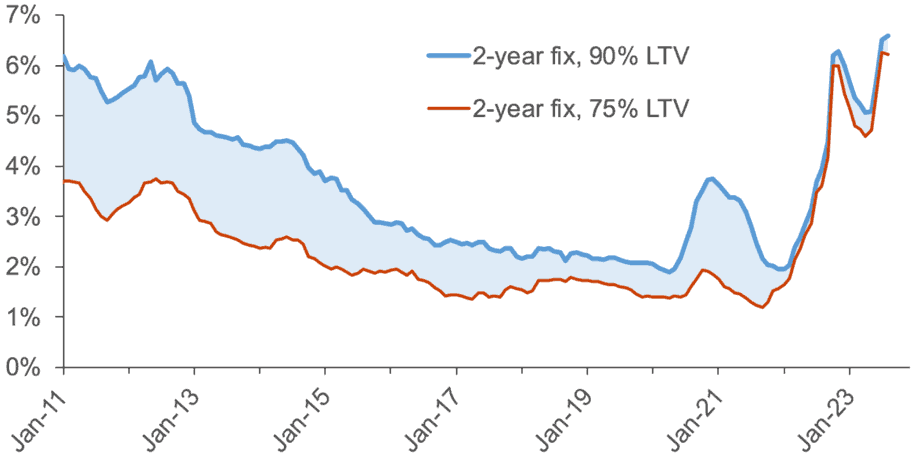
Source: Bank of England
Chart 6.4 shows that the vast majority of regulated[2] mortgages are on fixed rates. However, following a period of sustained increase, there was a sharp drop in the share of new mortgages on fixed rates in Q1 2023, to 83.1% from 94.5% the previous quarter. It is possible that the spike in advertised mortgage rates towards the end of 2022 following the UK Government mini-budget in September 2022 led to an increased share of customers choosing a variable-rate mortgage in the hope that mortgage rates would fall once the mortgage-market volatility subsided. More recently, there has been a small increase in the share of new lending at fixed rates, to 84.4% in Q2 2023. The share of outstanding regulated balances on fixed rates stood at 87.0% in Q2 2023, while the corresponding figures for non-regulated[3] mortgages were 81.0% for gross lending and 78.1% for outstanding balances. (Source: FCA).
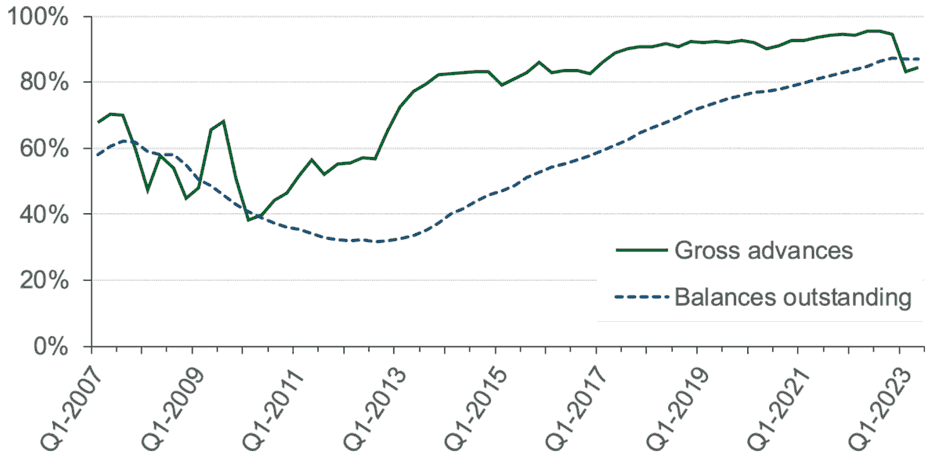
Source: FCA Mortgage Affordability
Contact
Email: Bruce.Teubes@gov.scot
There is a problem
Thanks for your feedback