Scottish Housing Market Review Q3 2023
Quarterly bulletin collating a range of previously published statistics on the latest trends in the Scottish housing market.
This document is part of a collection
2. House Prices
2.1. Scottish House Price Performance: National
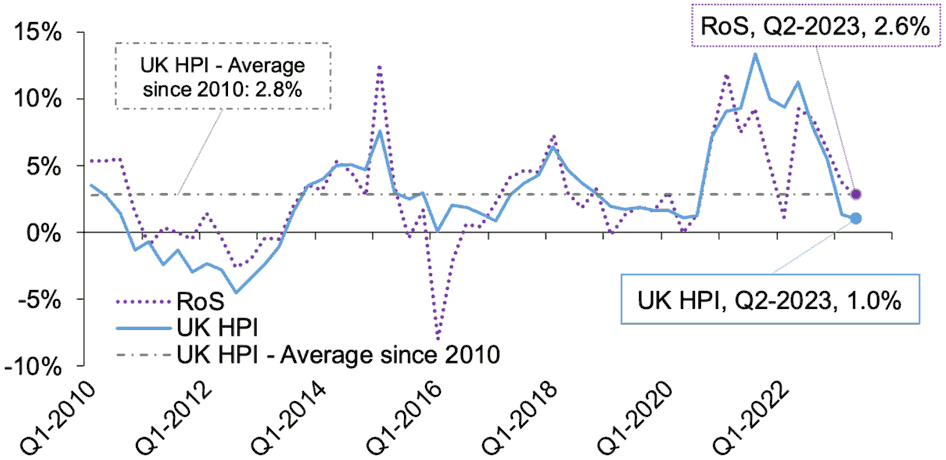
Source: Registers of Scotland, UK HPI (Scotland)
Average house prices in Scotland, as measured by the UK House Price Index (HPI), increased by an annual 1.0% in Q2 2023. This is down from the recent peak of 13.3% in Q3 2021, and represents the slowest rate of house price inflation since Q1 2017 and is also below the average annual quarterly change between 2010 and 2023 (2.8%). The average property price (mix-adjusted, geometric mean) in Scotland stood at £188K in Q2 2023. More recent monthly data (which tends to be more volatile than the quarterly averages) for July 2023 shows a further decline in house-price inflation to 0.1%.
Data from Registers of Scotland also suggests annual house price inflation slowed in Q2 2023. However, the rate of inflation was higher than the UK HPI measure at 2.6%, although this was down from 9.3% in Q2 2022. Registers of Scotland data is not mix-adjusted, so will be affected by the composition of properties sold. The average (arithmetic mean) house price in Scotland in Q2 2023 according to Registers of Scotland data was £214K.
UK HPI data shows that annual price growth in Q2 2023 was highest for semi-detached properties (1.3%), while terraced houses increased by the lowest amount (0.7%). The gap in price growth between different house types has narrowed recently: in Q3 2021, annual price growth for detached houses had reached 15.8%, while for flats it stood at 10.7%, likely influenced by a search for space in the aftermath of the pandemic.
2.2. Scottish House Price Performance by Dwelling/Buyer Type
Chart 2.2 shows the rate of change in the average new and existing build property prices in Scotland. This data is published with a lag relative to the headline HPI. In Q1 2023, the average Scottish new-build property price increased to a greater extent than the existing build price, rising by an annual 10.0% to £289K. The average existing build price was little changed over the year, rising by 0.4% to £177K. New-build prices have been affected by the large increase in construction material prices although in recent months material-price inflation has fallen sharply (see Chart 11.3).
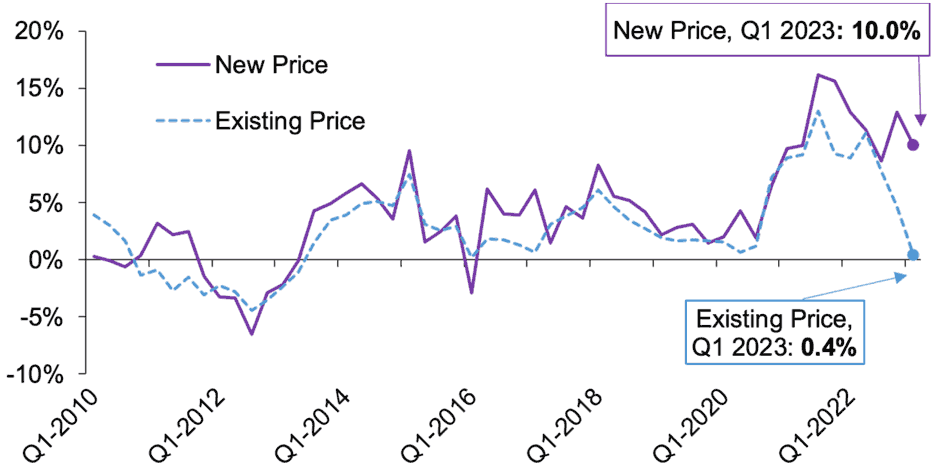
Source: UK HPI (Scotland)
The UK HPI also shows that the average price of a property bought by former owner occupiers in Scotland increased by an annual 0.9% in Q1 2023, to £227K. Meanwhile, the average price of a property purchased by a first-time buyer increased by an annual 1.0% in Q1 2023, to £151K.
2.3. Scottish House Price Performance: Regional
Registers of Scotland data show that although house prices increased by an annual 2.6% in Q2 2023 across Scotland, there was a more mixed picture across the regions. Table 2.1 shows that four regions experienced positive house-price growth, with the highest rate of 4.4% in Tayside and Fife, while three regions experienced a decrease, with the largest decrease of 3.4% in the Forth Valley.
The longer-term trend (as measured by the annual change in the four-quarter moving average, which helps smooth volatility) shows that house price growth was positive not only at the Scotland-level (5.3%) but also across all regions, with the highest rate recorded in Clyde Valley (6.7%) and the lowest in Aberdeen/shire & Moray (0.6%).
Table 2.1 Regional house prices
Aberdeen/shire and Moray
Average Price – Q2 2023 £206K
12 Month Change -0.5%
Annual change (rolling 4 quarters) 0.6%
Edinburgh, Lothians and Borders
Average Price – Q2 2023 286K
12 Month Change 4.2%
Annual change (rolling 4 quarters) 5.8%
Argyll & Bute and Highland & Islands
Average Price – Q2 2023 £212K
12 Month Change -1.3%
Annual change (rolling 4 quarters) 5.7%
Forth Valley
Average Price – Q2 2023 £194K
12 Month Change -3.4%
Annual change (rolling 4 quarters) 4.9%
Ayrshires and Dumfries & Galloway
Average Price – Q2 2023 £166K
12 Month Change 2.5%
Annual change (rolling 4 quarters) 6.0%
Tayside and Fife
Average Price – Q2 2023 £200K
12 Month Change 4.6%
Annual change (rolling 4 quarters) 5.3%
Clyde Valley
Average Price – Q2 2023 £196K
12 Month Change 4.4%
Annual change (rolling 4 quarters) 6.7%
Scotland
Average Price – Q2 2023 £214K
12 Month Change 2.6%
Annual change (rolling 4 quarters) 5.3%
Source: Registers of Scotland
Contact
Email: Bruce.Teubes@gov.scot
There is a problem
Thanks for your feedback