Greenhouse gas emissions projections: phase 1 and phase 2 modelling results
Analysis undertaken by Ricardo-AEA for the Scottish Government to provide an estimated projection of Scottish emissions from 2019 to 2045 which capture announced Scottish and UK policies.
1. Executive Summary
The Scottish Government has committed to ambitious emissions reduction targets, culminating in the achievement of net zero by 2045. This is underpinned by a planning process, covering 15-year periods and refreshed on a five-yearly basis. The next Climate Change Plan, covering the period 2025-2040, will be published in draft during late 2023. In order to develop this CCP, Scottish Government requires a clear understanding of the likely baseline of emissions implied by business-as-usual activities and policies and has commissioned Ricardo AEA Ltd to carry out this assessment.
The Scottish Government presented in their "Update to the Climate Change Plan 2018 – 2032: Securing a Green Recovery on a Path to Net Zero, 16 Dec 2020" (referred to hereafter as Climate Change Plan Update, or CCPu)[1] a pathway to their new and ambitious targets set by the Climate Change (Emissions Reduction Targets) (Scotland) Act 2019.[2] The required outcome of the CCPu is to deliver Scotland's yearly climate change targets (and ultimately contribute to the net zero by 2045 target).
The project aimed to:
- Provide projections of emissions sources under a business-as-usual scenario for each year from 2019 through to 2045.
- Quantify the impacts at this point in time of policies in place by providing a set of greenhouse gas (GHG) projections that considers quantifiable mitigation actions laid out in the CCPu.
- Generate estimates of the emissions reductions that result from each of the policy outcomes as set out in the CCPu and policy papers published since.
- Base projections on a bottom-up aggregation.
The emissions projections will be an important component in subsequent work by Scottish Government to identify the level of abatement required in the next Climate Change Plan.
The sectors modelled were Agriculture, Buildings, Electricity, Industry, Transport, Waste, Negative Emission Technologies (NETs), and Land Use, Land-Use Change and Forestry (LULUCF).
A range of scenarios were modelled, including high and low economic growth scenarios, and high and low hydrogen scenarios. This executive summary focuses on the central scenario; in this scenario, economic growth assumptions are the same as in the baseline scenario, but the CCPu policies and proposals for each sector serve to mitigate GHG emissions.
There have been two Phases to the work:
- Phase 1 estimated a trajectory of GHG emissions delivered by the CCPu policy package and including subsequent policy publications. This phase captured the possible impact of the policies as written at the time of publication.
- Phase 2 allowed for further refinements to the modelling, and notably introduced higher levels of ambition for some sectors, based on the intended "Outcomes" set out in the CCPu.
Presented below are the results from the Phase 1 and Phase 2 modelling, focusing on the "Central" scenario. The modelling assumptions, policy impacts, uncertainties and sensitivities for each sector are discussed in more detail in subsequent chapters.
Note that the LULUCF sector took a different approach to the other sectors, which is discussed further in Section 11.
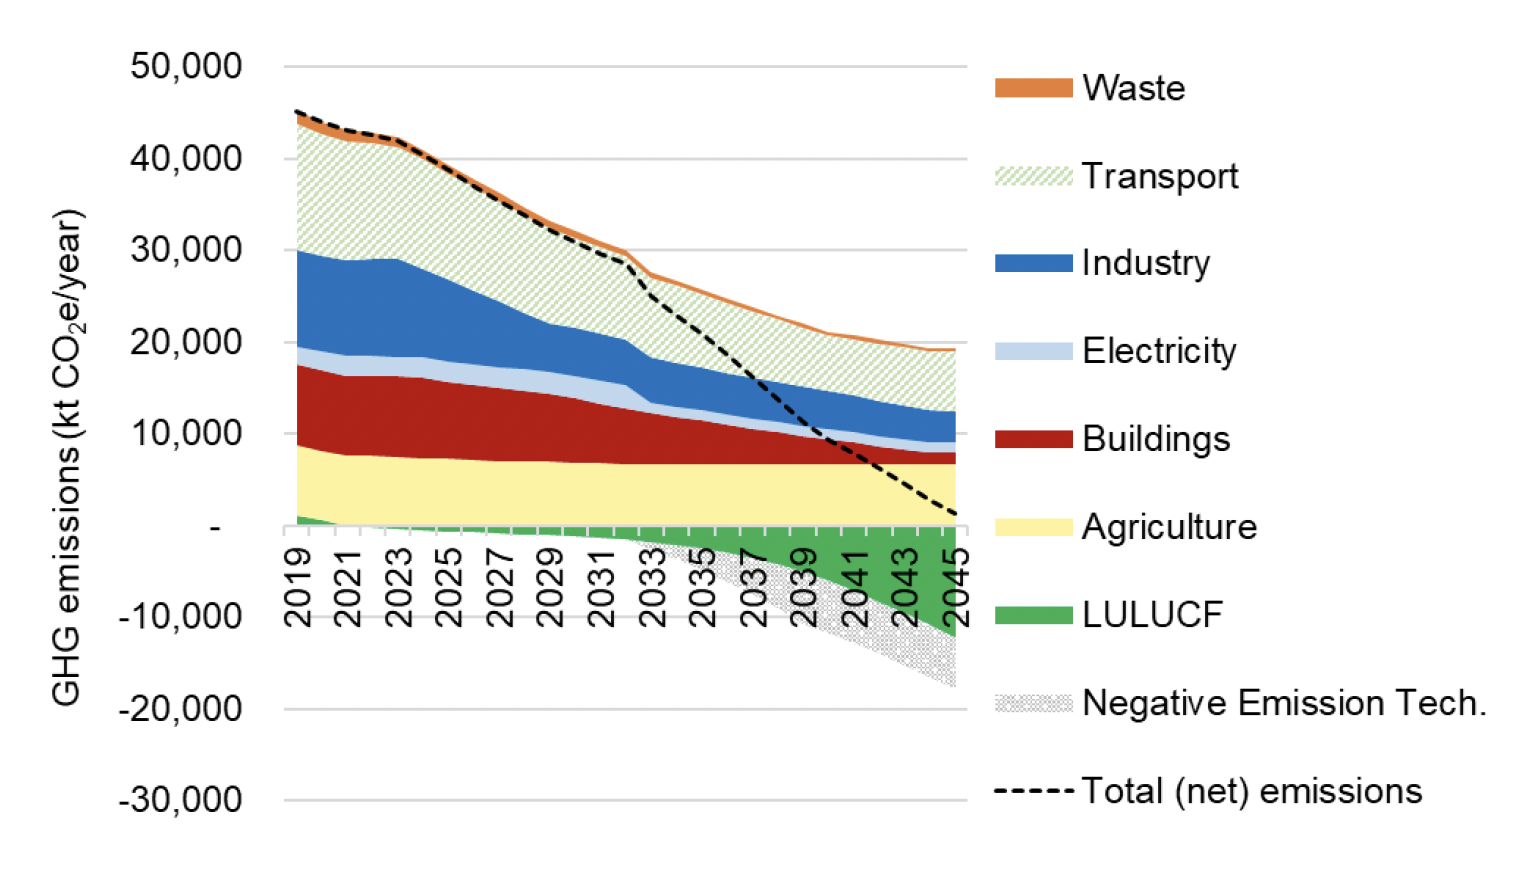
Phase 1 results – Central scenario
Figure 1‑1: Total emissions (kt CO2e) split by sector for the Central scenario of the Phase 1 modelling shows total GHG emissions and sectoral contributions throughout the projection period for the central scenario of the Phase 1 modelling. Table 1‑1 shows the results of the Phase 1 modelling (i.e., of policies assessed during the study) for the central scenario (including the LULUCF sector) for key years. Note that 2032 is included as a key year as this is the end-year for the CCPu.
| 2025 | 2030 | 2032 | 2035 | 2040 | 2045 | 2050 | |
|---|---|---|---|---|---|---|---|
| Emissions reduction from baseline (kt CO2e) | 5,763 | 13,887 | 16,781 | 24,981 | 37,371 | 46,224 | 52,923 |
| Percentage reduction from baseline | 13% | 31% | 37% | 55% | 80% | 97% | 111% |
Key take-home points from this analysis are that:
- The biggest emissions reductions are from the Buildings and Transport sectors. Emissions reductions in these sectors are primarily associated with the phase-down of fossil fuel use in favour of electrically powered technologies or other zero emission alternatives. In both cases, this type of "fuel switching" has a larger GHG emissions impact than measures aimed at energy demand reduction such as increasing sustainable travel modes or retrofitting buildings. However, such measures should still be seen as important as they help to minimise demands on grid infrastructure, avoid indirect emissions from vehicle manufacture, reduce people's energy bills, and so on.
- Industrial sector decarbonisation is assumed to proceed in line with the requirements of the UK Emissions Trading Scheme (ETS). This is the key policy driving GHG reductions in the industrial sector; the majority of the other CCPu proposals were considered not to have a quantifiable impact on emissions although they would act as supporting measures that could facilitate decarbonisation.
- The results show "negative emissions" from the LULUCF sector, as peatland restoration and afforestation would increasingly act as a carbon sink, along with NETs. However, in both cases the results should be interpreted with great caution.[3] The complexity of the LULUCF sector contributes to relatively high uncertainty in the net emissions from this sector, as all sources and sinks are based on computer models rather than direct measurement. The central scenario modelled for LULUCF is based on ambitious peatland restoration rates, but the feasibility of this scenario is unclear. In the case of NETs, we have modelled the sector reaching the quantitative targets set out in the CCPu. However, the sector is in its infancy and the specific proposals in the CCPu would not necessarily guarantee this level of deployment. If one excludes the LULUCF and NETs from the analysis, GHG emissions in 2045 would be close to 20 MtCO2e.
- The Agriculture sector shows a relatively small reduction in emissions which, in this analysis, is driven by the Agricultural Transformation Programme. Most of the other policies relating to the Agriculture sector do not have quantifiable GHG emissions impacts, either because they are considered supporting measures or due to lack of data.
- For the Waste sector, reducing the amount of biodegradable waste sent to landfill is considered the main driver of GHG emissions reductions. The target of reducing food waste would contribute towards further reductions. Waste is a complicated sector and there were some measures, such as the aim of establishing a more circular economy, which hold the potential to reduce net emissions globally but where it was not possible to provide a quantitative, sector-based estimate within the scope of this project.
- Electrification, which is key to reducing emissions from the Buildings, Transport and Industry sectors in particular, will rely on access to a secure, reliable source of renewable electricity. The Electricity sector policies in the CCPu can therefore be said to reduce emissions from multiple sectors indirectly, inasmuch as they minimise the need to generate electricity using unabated fossil fuels. The largest impacts in this sector that have been assessed in this study are associated with (a) to the Peterhead gas power station being decommissioned and replaced with a carbon capture, storage and utilisation (CCS) gas power station and (b) additional offshore wind capacity.
The results of this analysis show Scotland coming very close to its net zero target by 2045, and achieving net negative emissions by 2050. However, bearing in mind the uncertainty around the LULUCF estimates and deployment of NETs in particular, there is a very high risk that the Scottish Government's statutory targets will not be achieved through reliance on action covered by Phase 1 and without additional policies.
As shown above, without the GHG reductions from the LULUCF and NETs, there could be a gap of close to 20 MtCO2e by 2045 between actual emissions and the target level without additional policies. That may still be an optimistic assessment given the lack of a defined regulatory approach for some important mitigation measures, such as phasing out fossil fuel heating in buildings.
Action by the UK government on reserved areas also supports Scottish decarbonisation, with – for example – regulations being implemented around the phase out of ICE vehicles. These are expected to play a key role; the UK ETS (and its supporting measures) is estimated in this study to provide reductions of 6,013 kt CO2e in 2032 (see Table 7‑8). Nonetheless, the results of Phase 1 highlight the need for further action.
The Scottish Government is considering new policies as part of the development of the next Climate Change Plan and the ongoing implementation and development of strategies, plans and policies at a sector level.
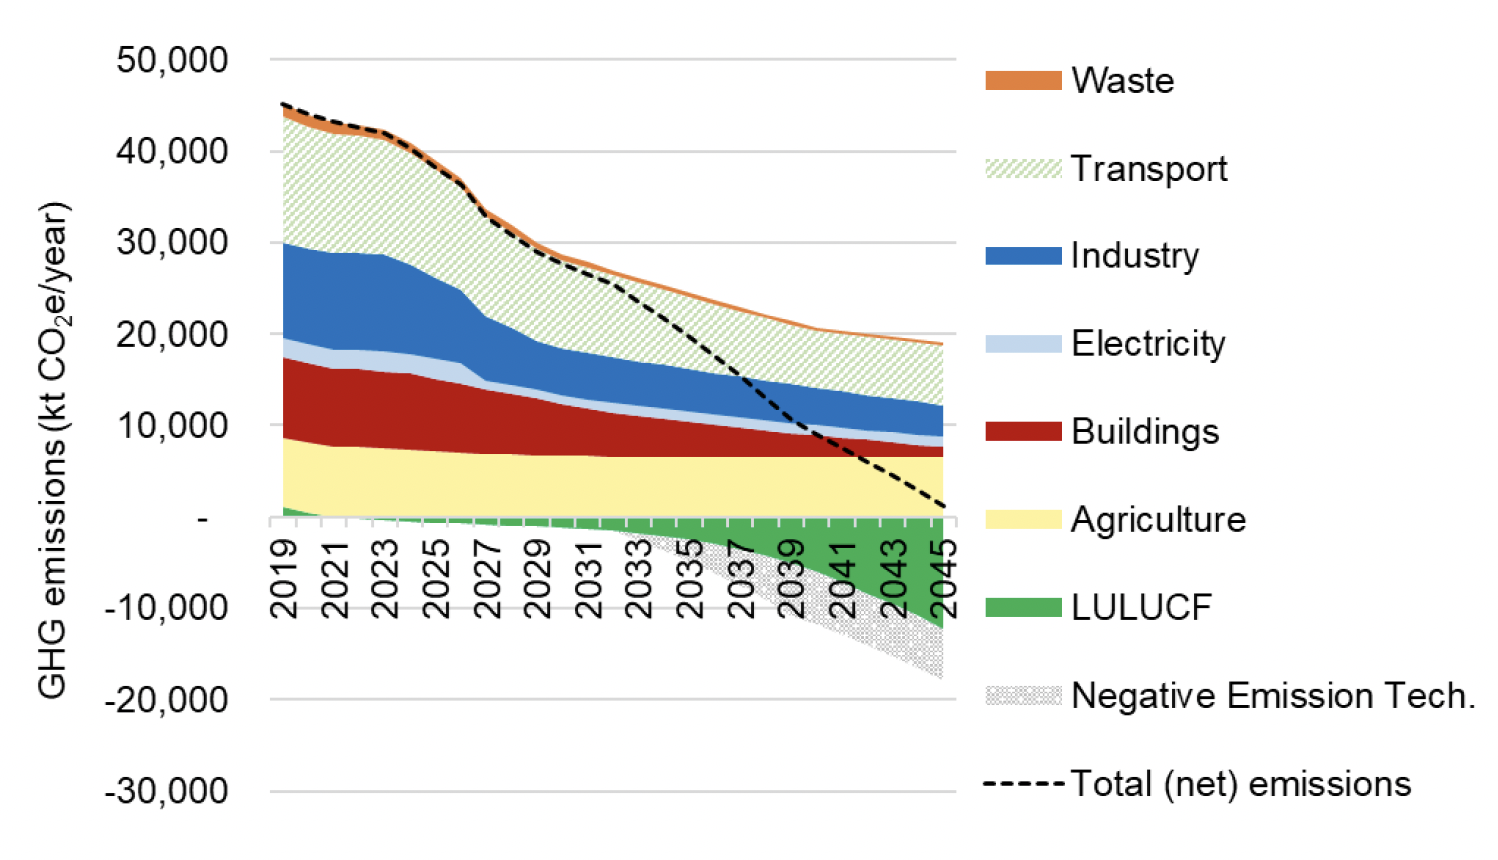
Phase 2 results – Central scenario
Figure 1‑2 shows total GHG emissions and sectoral contributions throughout the projection period for the central scenario of the Phase 1 modelling. Table 1‑2 shows the results of the Phase 2 modelling (i.e., of policies) for the central scenario (including the LULUCF sector) for key years.
| 2025 | 2030 | 2032 | 2035 | 2040 | 2045 | 2050 | |
|---|---|---|---|---|---|---|---|
| Emissions reduction from baseline (kt CO2e) | 6,176 | 17,146 | 19,767 | 26,122 | 37,781 | 46,397 | 53,096 |
| Percentage reduction from baseline | 14% | 38% | 44% | 57% | 81% | 98% | 111% |
Net GHG emissions in 2045 are calculated to be slightly lower in Phase 2 than Phase 1, although both phases were calculated to achieve a similar overall reduction in emissions of c. 97-98%. As stated previously, these figures should be interpreted with great caution due to uncertainties in all sectors, but especially regarding LULUCF and NETs.
The difference in Phase 2 is due to small additional GHG reductions occurring in the Agriculture, Buildings and Transport sectors:
- In Agriculture the difference is due to assessing outcomes rather than a difference in the overall level of ambition.
- In Buildings the difference is due to changes in the targets that were modelled for non-domestic buildings; in Phase 1 this was based on decarbonising a certain number of buildings whereas in Phase 2 the targets related to overall fossil fuel consumption.
- In Transport the difference is primarily due to greater reductions in private vehicle use.
No further reductions in Phase 2 are seen in the NETs, Industry, and Waste sectors as no further impacts were modelled in these sectors – this is because no further quantifiable targets were identified through discussions with Scottish Government in these sectors at the time of writing. In some cases, there was a change in the cumulative emissions for certain sectors, due to the adoption of stronger policy ambition or changes in the timing of measures. For example, for the Electricity sector, 2045 emissions are the same between Phase 1 and Phase 2, but Phase 2 sees emissions reduce to their final level much earlier due to the change in presumed timing of CCS at Peterhead. Further details of the modelling methodology for each sector, including differences between Phases 1 and 2, are provided in subsequent chapters of this report.
The most important take-home points of the Phase 2 analysis are similar to those described for Phase 1 (see above). The Phase 2 modelling also highlights the potential to achieve lower cumulative emissions though adoption of stronger policy ambition and/or bringing forward key policy interventions.
Conclusions
The modelling results of this study show GHG emissions getting close to net zero by 2045. However, when interpreting these results it is important to account for uncertainties in the modelling work, and the lack of specific delivery mechanisms for many of the CCPu proposals.
In many cases, policies and proposals in the CCPu are expressed as high-level targets where the regulatory approach, timing, funding sources, and so on have not yet been confirmed. For example, in the NETs sector, we were able to model the impact of deployment targets because these are expressed quantitatively. But the commitments in the CCPu (e.g. "Support the development of NETs technologies within Scotland") are non-specific – there is no clear pathway towards delivering the targets for NETs. Similar examples exist for other sectors. On that basis, this study indicates that the policies and outcomes set out in the CCPu need to be built on to meet annual emissions envelopes and targets set out under the Climate Change (Emissions Reduction Targets) (Scotland) Act 2019.
It is typical for governments to adopt different approaches, ranging from direct action to indirect influence and awareness-raising, to try and achieve GHG reductions. So, not all the Scottish Government's policies and proposals need to result in quantifiable emissions reductions in order to provide an environmental benefit. However, for proposals that do require a quantitative assessment, it is recommended that these should be:
- linked to quantitative targets or metrics;
- backed up by specific policy proposals; and
- confirmed through allocation of funding, relevant legislation, etc.
This would give greater confidence that the GHG reductions can be achieved.
Contact
Email: Edward.Mchardy@gov.scot
There is a problem
Thanks for your feedback