Greenhouse gas emissions projections: phase 1 and phase 2 modelling results
Analysis undertaken by Ricardo-AEA for the Scottish Government to provide an estimated projection of Scottish emissions from 2019 to 2045 which capture announced Scottish and UK policies.
12. Final modelling outcome
Phase 1 (CCPu Policy Impacts)
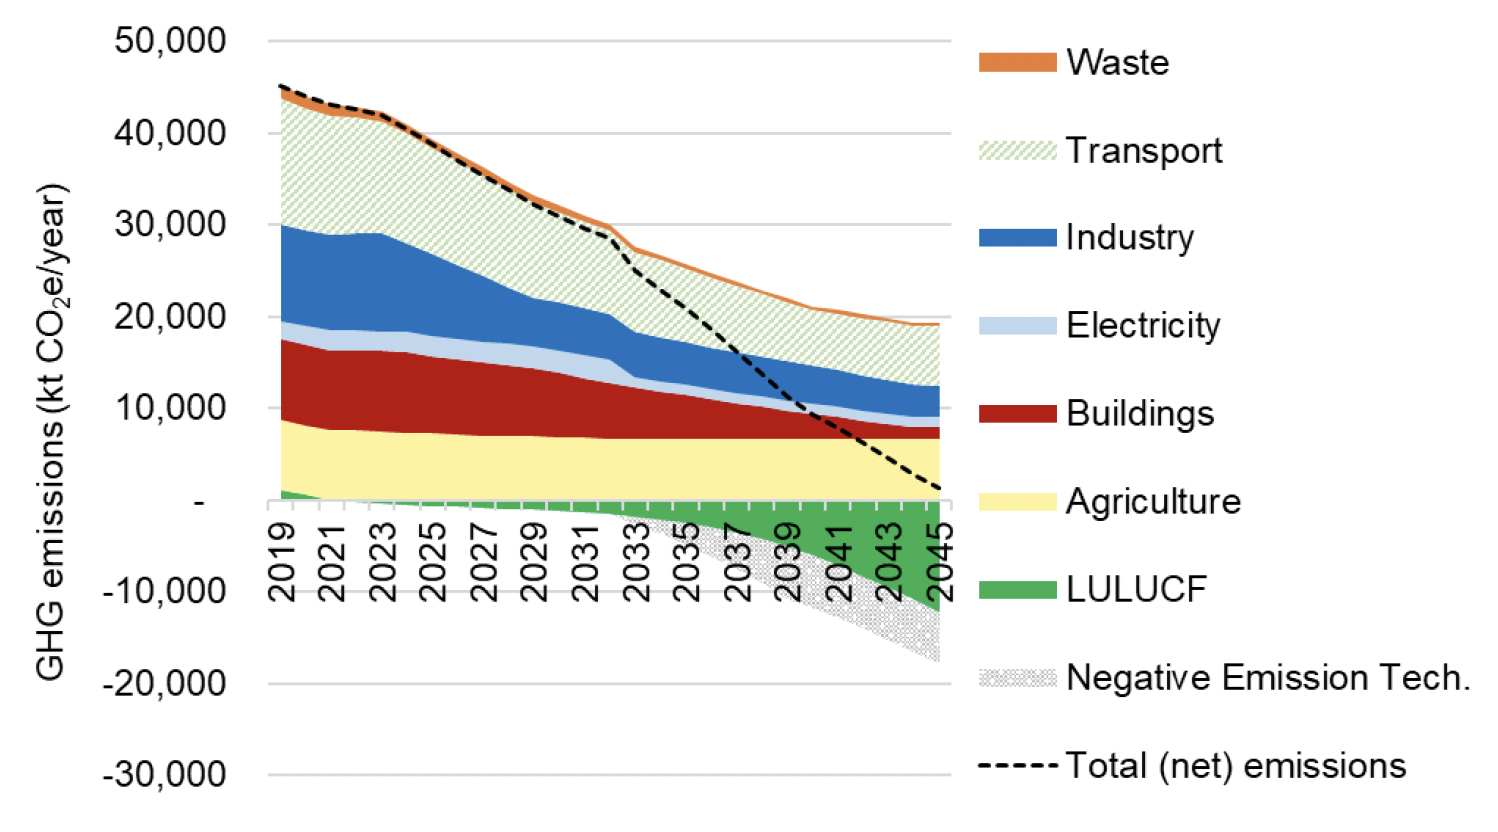
Figure 12‑1shows total GHG emissions and sectoral contributions throughout the projection period for the central scenario of the Phase 1 modelling. Table 12‑1Table 1‑1 shows the results of the Phase 1 modelling (i.e., of policies assessed during the study) for the central scenario (including the LULUCF sector) for key years. Note that 2032 is included as a key year as this is the end-year for the CCPu.
| 2025 | 2030 | 2032 | 2035 | 2040 | 2045 | 2050 | |
|---|---|---|---|---|---|---|---|
| Emissions reduction from baseline (kt CO2e) | 5,763 | 13,887 | 16,781 | 24,981 | 37,371 | 46,224 | 52,923 |
| Percentage reduction from baseline | 13% | 31% | 37% | 55% | 80% | 97% | 111% |
Key take-home points from this analysis are summarised below:
- The biggest emissions reductions are from the Buildings and Transport sectors. Emissions reductions in these sectors are primarily associated with the phase-down of fossil fuel use in favour of electrically powered technologies or other zero emission alternatives. In both cases, this type of "fuel switching" has a larger GHG emissions impact than measures aimed at energy demand reduction such as increasing sustainable travel modes or retrofitting buildings. However, such measures should still be seen as important as they help to minimise demands on grid infrastructure, avoid indirect emissions from vehicle manufacture, reduce people's energy bills, and so on.
- Industrial sector decarbonisation is assumed to proceed in line with the requirements of the UK Emissions Trading Scheme (ETS). This is the key policy driving GHG reductions in the industrial sector; the majority of the other CCPu proposals were considered not to have a quantifiable impact on emissions although they would act as supporting measures that could facilitate decarbonisation.
- The results show "negative emissions" from the LULUCF sector, as peatland restoration and afforestation would increasingly act as a carbon sink, along with NETs. However, in both cases the results should be interpreted with great caution.[61] The complexity of the LULUCF sector contributes to relatively high uncertainty in the net emissions from this sector, as all sources and sinks are based on computer models rather than direct measurement. The central scenario modelled for LULUCF is based on ambitious peatland restoration rates, but the feasibility of this scenario is unclear. In the case of NETs, we have modelled the sector reaching the quantitative targets set out in the CCPu. However, the sector is in its infancy and the specific proposals in the CCPu would not necessarily guarantee this level of deployment. If one excludes the LULUCF and NETs from the analysis, GHG emissions in 2045 would be close to 20 MtCO2e.
- The Agriculture sector shows a relatively small reduction in emissions which, in this analysis, is driven by the Agricultural Transformation Programme. Most of the other policies relating to the Agriculture sector do not have quantifiable GHG emissions impacts, either because they are considered supporting measures or due to lack of data.
- For the Waste sector, reducing the amount of biodegradable waste sent to landfill is considered the main driver of GHG emissions reductions. The target of reducing food waste would contribute towards further reductions. Waste is a complicated sector and there were some measures, such as the aim of establishing a more circular economy, which hold the potential to reduce net emissions globally but where it was not possible to provide a quantitative, sector-based estimate within the scope of this project.
- Electrification, which is key to reducing emissions from the Buildings, Transport and Industry sectors in particular, will rely on access to a secure, reliable source of renewable electricity. The Electricity sector policies in the CCPu can therefore be said to reduce emissions from multiple sectors indirectly, inasmuch as they minimise the need to generate electricity using unabated fossil fuels. The largest impacts in this sector that have been assessed in this study are associated with (a) to the Peterhead gas power station being decommissioned and replaced with a carbon capture, storage and utilisation (CCS) gas power station and (b) additional offshore wind capacity.
The results of this analysis show Scotland coming very close to its net zero target by 2045 and achieving net negative emissions by 2050. However, bearing in mind the uncertainty around the LULUCF estimates and deployment of NETs in particular, there is a very high risk that the Scottish Government's statutory targets will not be achieved through reliance on action covered by Phase 1 and without additional policies. As shown above, without the GHG reductions from the LULUCF and NETs, there could be a gap of close to 20 MtCO2e by 2045 between actual emissions and the target level without additional policies. That may still be an optimistic assessment given the lack of a defined regulatory approach for some important mitigation measures, such as phasing out fossil fuel heating in buildings.
The sensitivity of results to the different growth scenarios is discussed below, with the Phase 2 results.
Phase 2 (CCPu Outcome Impacts)
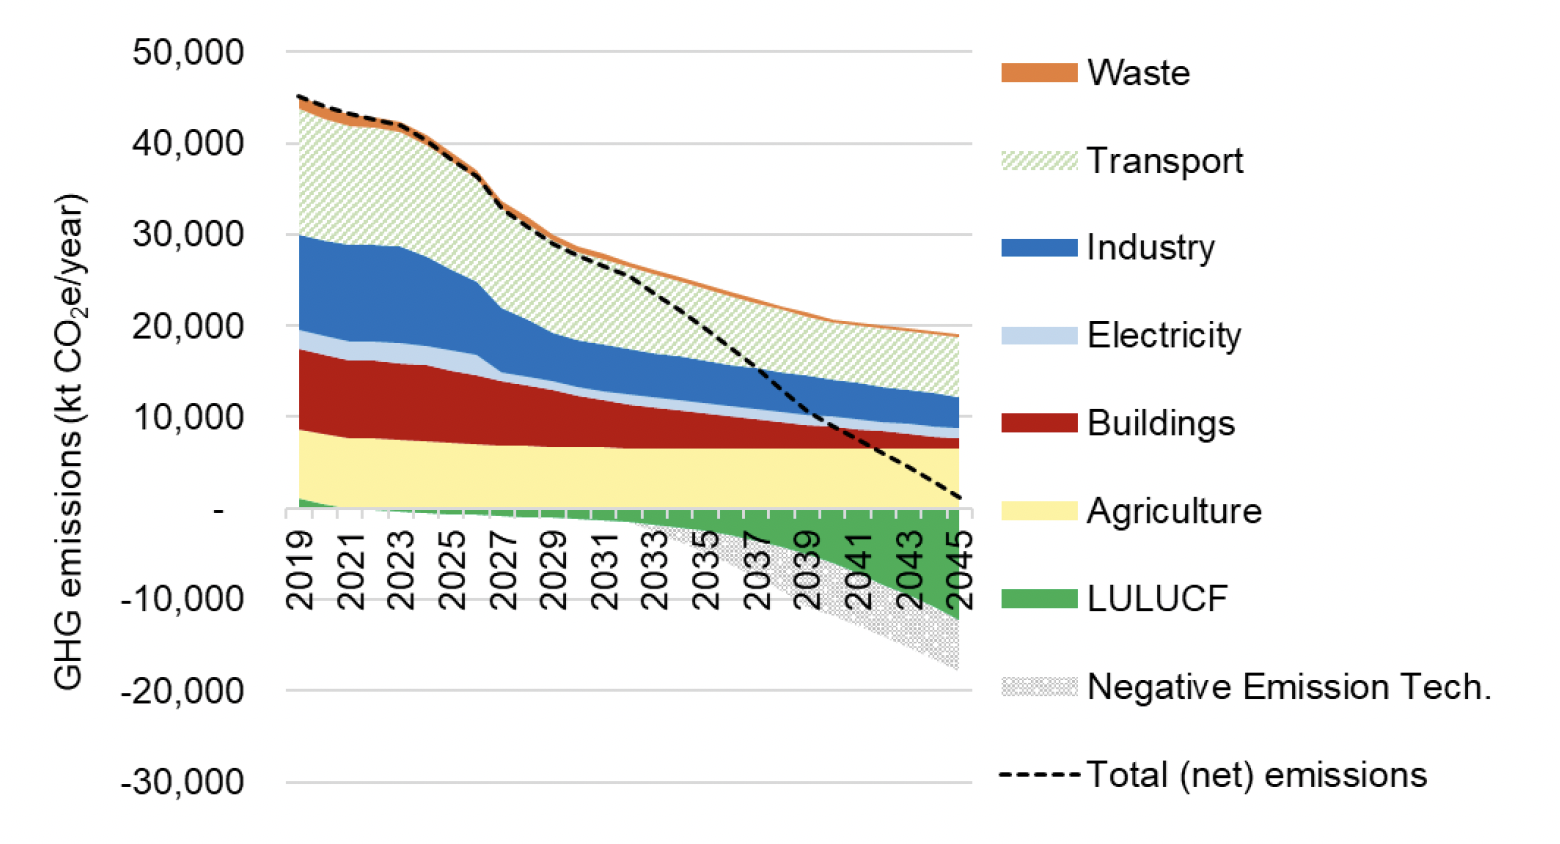
Figure 12‑2 shows total GHG emissions and sectoral contributions throughout the projection period for the central scenario of the Phase 1 modelling. Table 12‑2 shows the results of the Phase 2 modelling (i.e., of policies) for the central scenario (including the LULUCF sector) for key years.
| 2025 | 2030 | 2032 | 2035 | 2040 | 2045 | 2050 | |
|---|---|---|---|---|---|---|---|
| Emissions reduction from baseline (kt CO2e) | 6,176 | 17,146 | 19,767 | 26,122 | 37,781 | 46,397 | 53,096 |
| Percentage reduction from baseline | 14% | 38% | 44% | 57% | 81% | 98% | 111% |
As with Phase 1, all sectors see reductions in GHG emissions to 2045, but residual emissions remain in all sectors (apart from LULUCF and NETs). The LULUCF and NETs sectors are expected to help mitigate these residual emissions, but again it is very important to note the high uncertainty associated with both the scale of reductions that can be achieved, and the likelihood/timing of delivery.
The difference in Phase 2 is due to small additional GHG reductions occurring in the Agriculture, Buildings and Transport sectors:
- In Agriculture the difference is due to updates in the modelling methodology rather than a difference in the overall level of ambition.
- In Buildings the difference is due to changes in the targets that were modelled for non-domestic buildings; in Phase 1 this was based on decarbonising a certain number of buildings whereas in Phase 2 the targets related to overall fossil fuel consumption.
- In Transport the difference is primarily due to greater reductions in private vehicle use.
No further reductions in Phase 2 are seen in the NETs, Industry, and Waste sectors as no further impacts were modelled in these sectors – this is because no further quantifiable targets were identified through discussions with Scottish Government in these sectors at the time of writing. In some cases, there was a change in the cumulative emissions for certain sectors, for example due to changes in the timing of measures. For example, for the Electricity sector, 2045 emissions are the same between Phase 1 and Phase 2, but Phase 2 sees emissions reduce to their final level much earlier due to the change in presumed timing of CCS at Peterhead. The most significant emissions reductions from the baseline in 2045 are seen in the Industry sector (-8,187 ktCO2e under the central scenario in 2045), the Buildings sector (-8,217 ktCO2e under the central scenario in 2,045), and the transport sector (-7,491 ktCO2e under the central scenario in 2045). NETs also contribute significantly, accounting for -5,700 ktCO2e of emissions reductions under the Central scenario in 2045. Smaller contributions are made by the Electricity sector (-1,462 ktCO2e under the central scenario in 2045), the Agriculture sector (-1,007 ktCO2e under the central scenario in 2045) and the Waste sector (-493 ktCO2e under the central scenario in 2045).
The most important take-home points of the Phase 2 analysis are similar to those described for Phase 1 (see above). The Phase 2 modelling also highlights the potential to achieve lower cumulative emissions though adoption of stronger policy ambition and/or bringing forward key policy interventions.
Comparison between scenarios
The graphs below present a time-series of emissions under all modelled scenarios, for both Phase 1 (Figure 12‑3) and Phase 2 (Figure 12‑4) of the modelling.
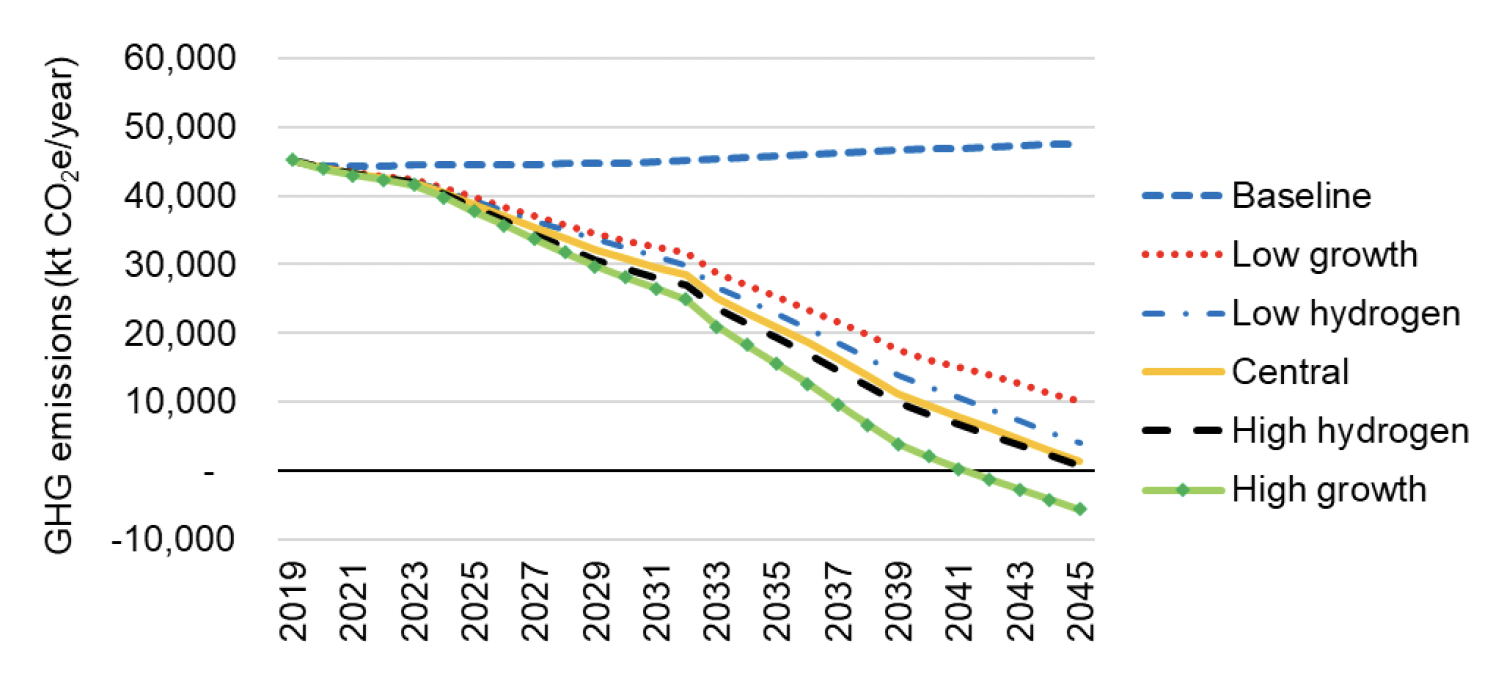
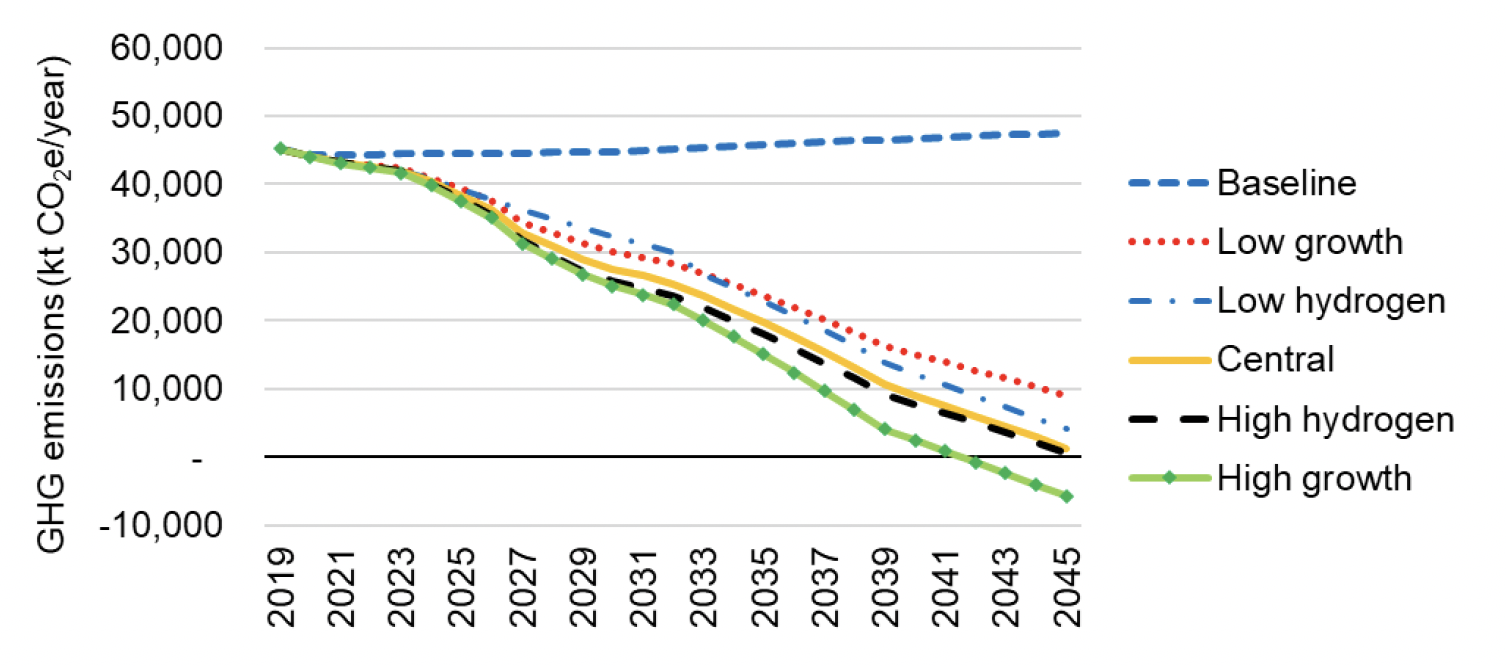
While the differences in results between the different growth scenarios appear limited, they are nonetheless materially important. Under Phase 2, the high growth scenario delivers reductions of 53,346 ktCO2e, while the low scenario delivers reductions of 38,689 ktCO2e – the high growth scenario therefore delivers reductions 38% higher than the low growth scenario.
Hydrogen scenarios were only modelled for Buildings, Industry and NETs, as these were the only sectors where future hydrogen availability was considered likely to have a significant material impact on sector development and sectoral emissions. The differences between emissions projections under the growth scenarios and under the hydrogen scenarios are extremely small. The most important finding here, is that emissions projections are more sensitive to growth scenarios than to hydrogen scenarios (i.e., the difference between growth scenario results is greater than between hydrogen scenario results), meaning that future economic growth can be expected to have a greater bearing on Scotland's future GHG emissions than the future availability of (green) hydrogen.
Contact
Email: Edward.Mchardy@gov.scot
There is a problem
Thanks for your feedback