Greenhouse gas emissions projections: phase 1 and phase 2 modelling results
Analysis undertaken by Ricardo-AEA for the Scottish Government to provide an estimated projection of Scottish emissions from 2019 to 2045 which capture announced Scottish and UK policies.
7. Industry sector
7.1 Sector Overview
7.1.1 Sector Background
Emissions from Industry represent a large proportion of total Scottish emissions, approximately 24% in 2019 according to the scope of Industry used in this study. These emissions are generated from a variety of activities across a diverse range of subsectors, predominantly refining and manufacturing.[30]
Recent Scottish Government commissioned research from Element Energy estimates that it could be possible for emissions from Scotland's large industrial sites to reduce by 80% or more by 2045, while maintaining output, if deep decarbonisation pathways are followed.[31]
In early 2023, the Scottish Net Zero Roadmap was published, which focuses on ways to decarbonise the industrial cluster along Scotland's east coast. The Roadmap had not been published at the time this analysis was undertaken but it provides useful additional context for net zero policies affecting this sector.[32]
7.1.2 Subsectors Considered
The Industry sector was disaggregated into the following subsectors:
- Cement
- Chemicals
- Food & Beverage
- Glass
- Metals
- Oil & gas extraction
- Paper
- Refineries
- Other (ETS installations)
- Other (non-ETS installations)
7.1.3 Data Sources
| Purpose | Data used | Comment |
|---|---|---|
| GHG inventory and energy consumption for Scotland | UK National Atmospheric Emissions Inventory (UK NAEI) 2019 | GHG inventory and energy consumption for Scotland needed to estimate impacts of policies on emissions and energy use. |
| UK ETS trajectory | Developing the UK Emissions Trading Scheme (UK ETS) A joint consultation of the UK Government, the Scottish Government, the Welsh Government and the Department of Agriculture, Environment and Rural Affairs for Northern Ireland[33], 2022 | Trajectory of cap under UK ETS |
| Industry subsector emission reductions | Deep Decarbonisation Pathways for Scottish Industries A study for the Scottish Government[30], 2020 | Abatement contributions to each subsector's decarbonisation potential by 2045 |
| Industry indicators | Climate Change Plan Monitoring Reports May 2021[34] | Industrial energy productivity and industrial emissions intensity in Scotland |
7.1.4 Underlying Drivers of Energy & Emissions
The following driver of energy and emissions was considered:
- Gross value added (GVA): CurrentGVA figures for each subsector were estimated using data from a 2021 ClimateXChange project that examined the impacts of emissions trading systems (average 2017-18 proxy used).[35] A projected annual growth of 0.7% was assumed for all subsectors, based on the 10-year average change in GVA as per ONS data.
7.2 Policy Measures and Outcomes Modelled
7.2.1 Phase 1 – Policy Measures
The primary policy for reducing GHG emissions from emissions intensive industries is the UK ETS. The key metric is the annual rate of reduction of the cap, which was applied to the portion of emissions from Industry that is included under the ETS.
Following our initial research, it was determined that insufficient data relating to the impacts of policies was available to fully assess the impacts of many of the policies/funds/proposals, namely the Scottish Industrial Decarbonisation Partnership and Making Scotland's Future programme. It was also decided that these policies are essentially enablers to support reductions being made within the ETS, and so including them would not change our analysis as those reductions would occur within the ETS cap anyway. Although data on the expected impacts of the Acorn CCS project was available, it was agreed that this would fall within ETS, so to avoid double counting this policy was not considered separately. The Acorn CCS project is also an example of the risks of delivering emissions reductions with policies that are outside the control of Scottish Government and require action at the UK government level.
It was agreed with Scottish Government that:
- For ETS sub-sectors (e.g. Chemicals, Glass etc), the UK ETS is considered as the overarching policy measure, with other policies being considered to be supporting measures, essentially enablers to support ETS objectives, so we did not model their impacts separately.
- For the "Other (non-ETS)" sub-sector, we considered the impacts of the Scottish Industrial Energy Transformation Fund, for which some indicative information was provided by Scottish Government
The following were considered to be policy measures:
- UK ETS: Emissions reductions in industry are expected to take place in line with the UK ETS trajectory. The trajectory was based on proposed changes to align the UK ETS cap and trajectory with the UK's net zero target.[36] This includes different trajectories for Phase 1 & 2 (2020- 2030) and Phase 3+ (2030 onwards) to reflect the different rates of reduction of the cap proposed for these periods. Although the cap is not expected to reduce linearly in Phases 1 and 2, Figure 4a in the analytical annex of the UK ETS consultation on carbon pricing[37] suggests that, in practice, emission reductions will be approximately linear up to 2030, as a result of the distribution of unallocated allowances. We therefore decided that disaggregating emissions reductions from the UK ETS into more steps would not provide significant additional value to this study at this stage. Given the nature of the emissions trading system, if reductions occur more quickly in one subsector, this allows for a slower rate of reduction in another sector through trading of allowances, and thus the net effect is alignment with the cap.
- The Scottish Industrial Energy Transformation Fund (SIETF) was also considered for the "Other (non-ETS)" sub-sector, based on an estimate by Scottish Government that it is expected to account for approximately 1% reduction of current total Industry emissions.
While not technically policies, three key methods ofindustrial decarbonisation—CCUS, fuel switching and improvements in energy efficiency—were treated as policy measures in the context of the model. The level of decarbonisation attributed to each of these technological solutions for each sub-sector was estimated based on existing literature. An indication of the impacts of these three drivers is provided below:
- CCUS is expected to be the main driver of decarbonisation in the oil and gas, chemicals, and cement sectors, delivering about 60% of the emissions abatement within these sectors. Note, although bioenergy and CCS ('BECCS') is expected to deliver negative emissions within the cement industry this was not considered here as it falls within the scope of the 'negative emissions technologies' sector.
- Fuel switching is expected to account for about two thirds of the emission reductions in other sub-sectors and 41% of the overall abatement. It should be noted that CCUS could also be considered instead of fuel switching, especially for large emission sources or those located in a CCS cluster, since it would deliver comparable emission reductions.
The following assumptions were used to estimate fuel switching in certain subsectors:
- Cement: A projected fuel mix of 70% of the thermal input from biomass, 20% from hydrogen and 10% from plasma (electrification), as modelled in a recent Feasibility Study for the Department for Business Energy and Industrial Strategy[38]
- Chemicals: Fuel switching again assumed to take place from fossil fuels to biomass, hydrogen and electrification. 55% blue and 45% green hydrogen assumed in line with 'Hydrogen pathway' to 2045[34]
- Food & drink: Fuel switching assumed to be to biomass[39] - in practice there are other options, e.g. some potential for electrification, but these were not modelled, to simplify the analysis
- Metals: It is assumed that in the future there will be an equal mix of biomass, electricity and hydrogen, as all three are considered potential options[40]
- Paper: It is assumed that fossil fuels are completely replaced by grid electricity in line with high emission reduction scenario in a recent study[41]
- Refineries: It is assumed that the ratio of blue:green hydrogen is 1:1, in line with the expectation that both will be utilised at the Grangemouth refinery[42]
- Incremental improvements in energy efficiency offer a moderate overall contribution (11% on average) but play a more important role in certain subsectors (e.g. food and drink).
7.2.2 Phase 2 – Outcomes
During Phase 2 of the project, Scottish Government requested to reflect in the modelling the fact that UK ETS cap had not yet come into effect. It was therefore agreed that 2024 should be used as the beginning of the UK ETS, rather than 2020 as had been used in Phase 1.
The only other change was to the GVA, changing projected annual GVA growth in industrial subsectors to 0.7%, in line with the 10-year average for Scotland[43] for all subsectors rather than the 0.8% used during Phase 1 of the project. The revised growth figure was retroactively applied to the Phase 1 results.
Table 7‑2, below, shows the additional outcomes and targets that were to be considered during Phase 2.
| Outcome | Target | Additional impacts modelled |
|---|---|---|
| Scotland's Industrial sector will be on a managed pathway to decarbonisation, whilst remaining highly competitive and on a sustainable growth trajectory. | No specific target- Scottish industry emissions will align with UK ETS pathway | None. ETS pathway already followed |
| Technologies critical to further industrial emissions reduction (such as carbon capture and storage and production and injection of hydrogen into the gas grid) are operating at commercial scale by 2030 | % of Scottish gas demand accounted for by biomethane and hydrogen blended into the gas network – No target | None required |
It was agreed that, due to the nature of these targets, no further modelling was required, besides the updates outlined above in section 7.3.1. These updates were applied to both Phases, for consistency.
7.2.3 Summary of Policy Packages
The table below indicates which policies were found to have the biggest potential impact within each package, which policies overlap with (or reinforce) each other, and which policies act as supporting measures.[44]
The primary policy for reducing GHG emissions from emissions intensive industries is the UK ETS, with other policies essentially enablers to support reductions being made within the ETS. For sectors that are not subject to the ETS, the key policy for reducing emissions is the Scottish Industrial Energy Transformation Fund.
| Policy | Categorisation |
|---|---|
| Policy 1: Emissions Trading Scheme (ETS): following EU Exit we will work with UK Government and other devolved administrations on maintaining carbon pricing that is at least as ambitious as the EU ETS. The Scottish Government's preference is to establish a UK ETS will have an interim cap 5% tighter than the EU ETS and will be reviewed for consistency with Net Zero in 2021. | Key policy |
| Policy 2: Deliver an Energy Transition Fund (ETF) to provide support for a sustainable, secure and inclusive energy transition in the North-East. | Supporting measure |
| Policy 4: Making Scotland's Future: multi-faceted programme will boost manufacturing productivity, innovation, and competitiveness, supporting manufacturing businesses to make the transition to net zero and realise the opportunities of a low carbon economy. | Supporting measure |
| Policy 5: Low Carbon Manufacturing Challenge Fund: to support innovation in low carbon technology, processes and infrastructure. Will be based on successful delivery of ERDF funded Advancing Manufacturing Challenge Fund. | Supporting measure |
| Policy | Categorisation |
|---|---|
| Proposal 1: Scottish Industrial Decarbonisation Partnership (SIDP): Scottish Government-convened cross-sector energy-intensive industrial (EII) stakeholder forum with representatives from manufacturing sites. Initial objectives: bring together other initiatives; build a shared narrative between government/industry on decarbonisation; and disseminate best-practice. | Supporting measure |
| Proposal 2: Deliver a Net Zero Transition Managers Programme to embed Managers in organisations tasked with identifying, quantifying and recommending decarbonisation opportunities for the business. | Supporting measure |
| Proposal 3: Establish a Grangemouth Future Industry Board (GFIB) – forum to coordinate public sector initiatives on growing economic activity at the Grangemouth industrial cluster, whilst supporting its transition to our low-carbon future. | Supporting measure |
| Proposal 4: Develop policy on providing market-benefit for Scottish industries that invest to decarbonise production. | Supporting measure |
| Proposal 5: Green Jobs Fund, to help businesses create new, green jobs, working with enterprise agencies to fund businesses that provide sustainable or low carbon products and services to help them develop, grow and create jobs. Further funding will help to ensure that businesses and supply chains across Scotland can capitalise on our investment in low carbon infrastructure such as the decarbonisation of heating and green transport. | Supporting measure |
| Proposal 6: Seizing the economic opportunity, we will work across government, enterprise agencies and the innovation system to identify strengths that can be built on as part of the decarbonisation journey, for example on The Clyde Mission and continued support for the Michelin Scotland Innovation Parc (MSIP). | Supporting measure |
| Policy | Categorisation |
|---|---|
| Policy 1: ACORN CCS Project: support the delivery of the CCS and Hydrogen capability at St. Fergus Gas Processing complex by 2025. | Supporting measure |
| Policy 2: Establish and deliver a Carbon Capture and Utilisation (CCU) Challenge Fund. | Supporting measure |
| Proposal 1: Emerging Energy Technologies Fund – to support the development of Hydrogen, CCUS and Negative emissions technologies. | Supporting measure |
| Proposal 2: Carbon Capture Utilisation and Storage (CCUS): work closely with the UK Government to get commercial, policy and regulatory frameworks required to support CCUS at scale in the UK." | Supporting measure |
| Proposal 3: Forums for CCUS and Blue (low-carbon) Hydrogen: to bring together industry, academics and membership organisations to promote and attract investment in CCUS and Blue Hydrogen. | Supporting measure |
| Proposal 4: Evidence for CCUS and Blue Hydrogen: building the evidence base on impact of technology, regulatory and market barriers. | Supporting measure |
| Proposal 5: Strategic development of Scotland's hydrogen economy – This is a cross-portfolio proposal that will impact on the delivery of multiple outcomes. | Supporting measure |
| Proposal 6: Hydrogen Demonstration: to replicate and scale-up demonstration projects and the evidence base for hydrogen based technologies. | Supporting measure |
| Policy Package | Policy | Categorisation |
|---|---|---|
| I2 Scottish Industrial Energy Transformation Fund |
Policy 3: Establish and deliver a Scottish Industrial Energy Transformation Fund (SIETF) – to support the decarbonisation of industrial manufacturing through a green economic recovery | Key policy |
7.2.4 Variation across scenarios
The baseline scenario represents a business-as-usual case which considers GVA as the main driver of emissions while emissions reductions in the central scenario aligns with the trajectory of the UK ETS. The high and low growth scenarios represent scenarios in which emissions reductions occur more slowly and more rapidly than the rest of the UK respectively. The high growth scenario is included on the basis that Scotland missed out on the first round of UK CCS funding which could mean that the rest of the UK declines faster than the UK ETS cap meaning emissions from Scottish industry reduce more slowly.
In the high hydrogen scenario, the Industry sector follows the "Hydrogen" emission trajectory set out in the in "Deep Decarbonisation Pathways for Scottish Industries" report (December 2020). In the low hydrogen scenario, it follows the "Electrification" emission trajectory set out in the same report.[45]
7.3 Emissions Projections
7.3.1 Phase 1 results
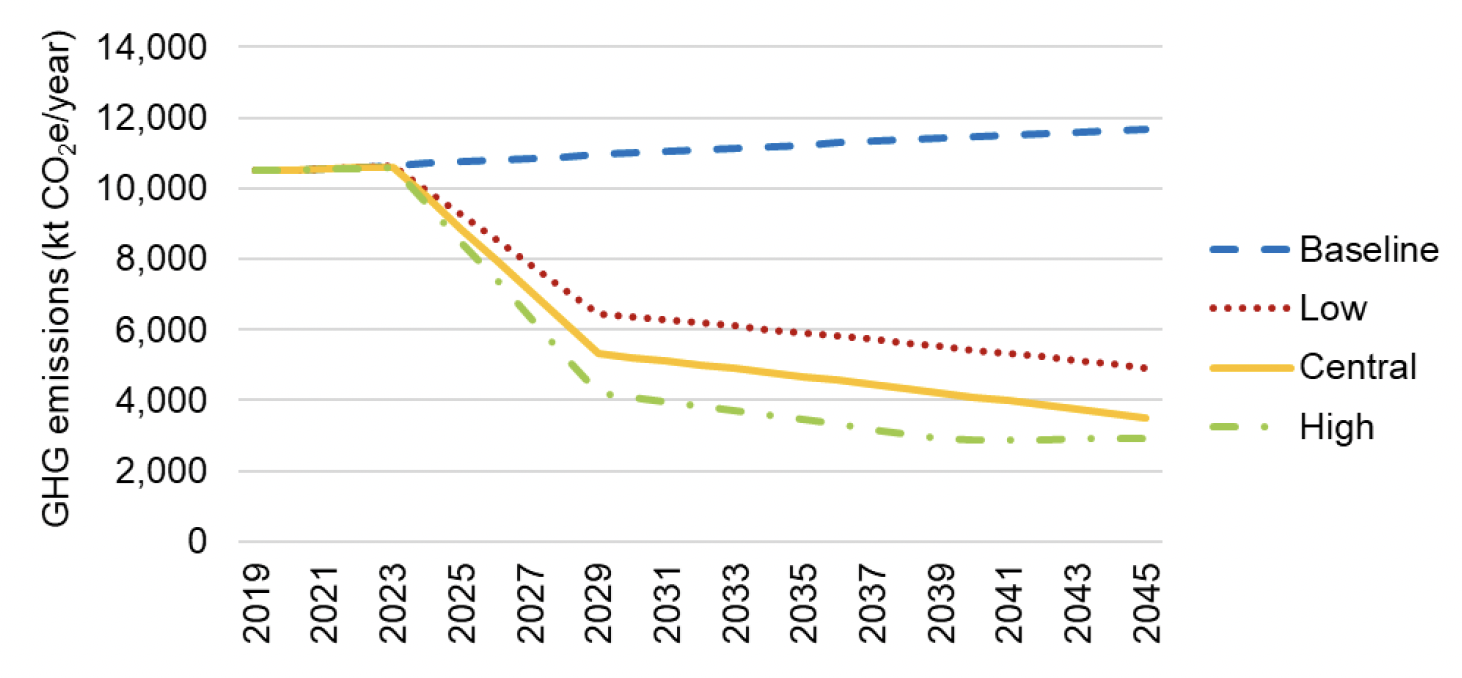
Compared to the baseline scenario, in which emissions gradually increase, overall Industry emissions are expected to reduce in line with the UK ETS cap in the projected scenarios. This means emissions are projected to reduce more rapidly initially in line with the steeper decline Phase 1 & 2 of the UK ETS, subject to uncertainties and sensitivities (see Sections 7.6 and 7.7), before a more gradual reduction after 2030. It should be noted that emissions do not reach zero. This is due to residual emissions from non-ETS installation and the fact that BECCS, which is expected to achieve significant emissions reductions in the cement sector, is considered within the Negative Emissions Technologies sector rather than Industry.
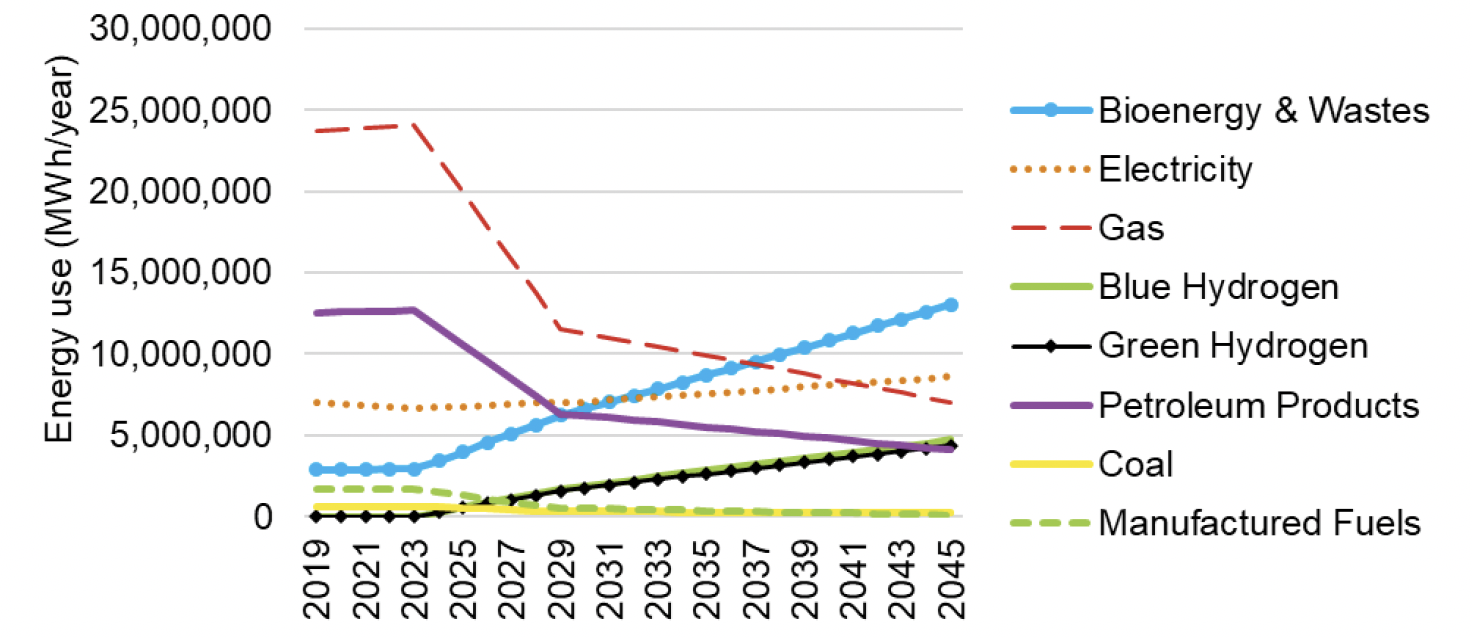
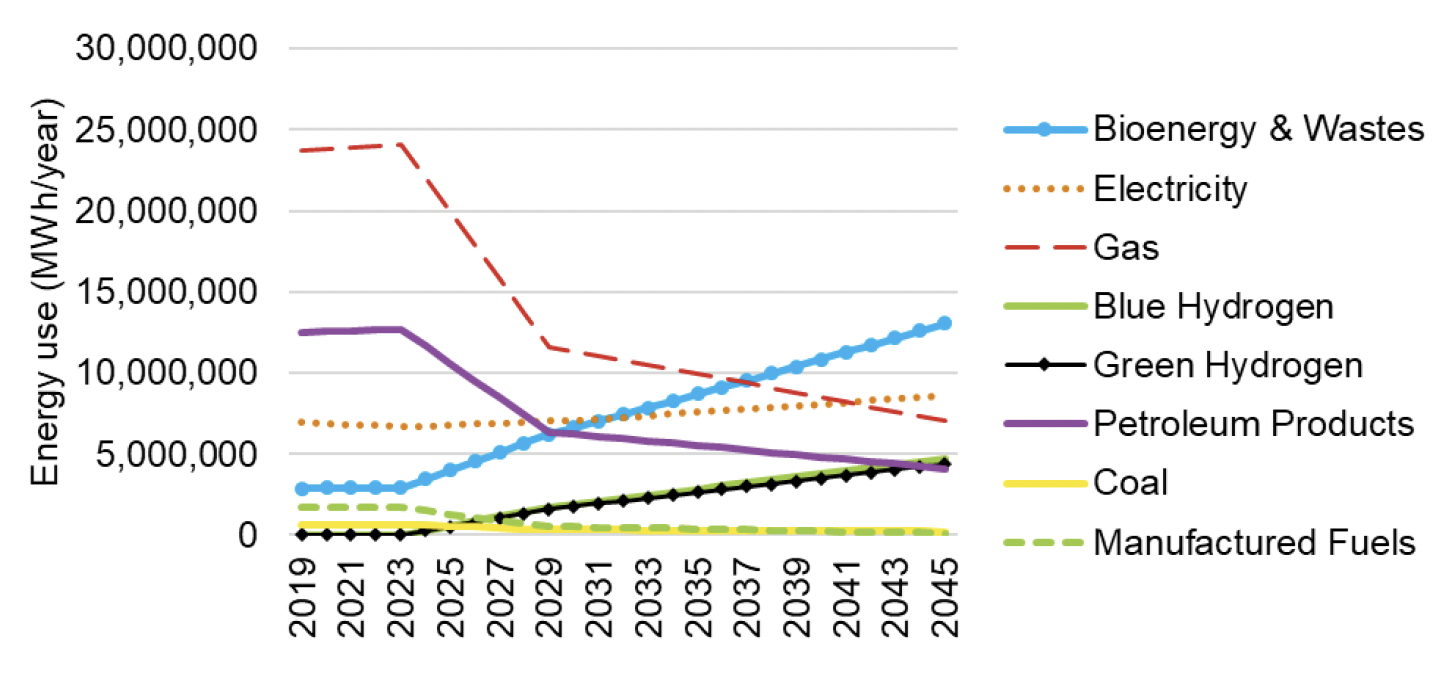
Projected changes in energy use reflect the fuel switching that is expected to take place within industry subsectors, as outlined in the 'Policy measures' section. Increased use of bioenergy & waste, blue and green hydrogen and renewable electricity is expected within Industry.
7.3.2 Phase 2 results
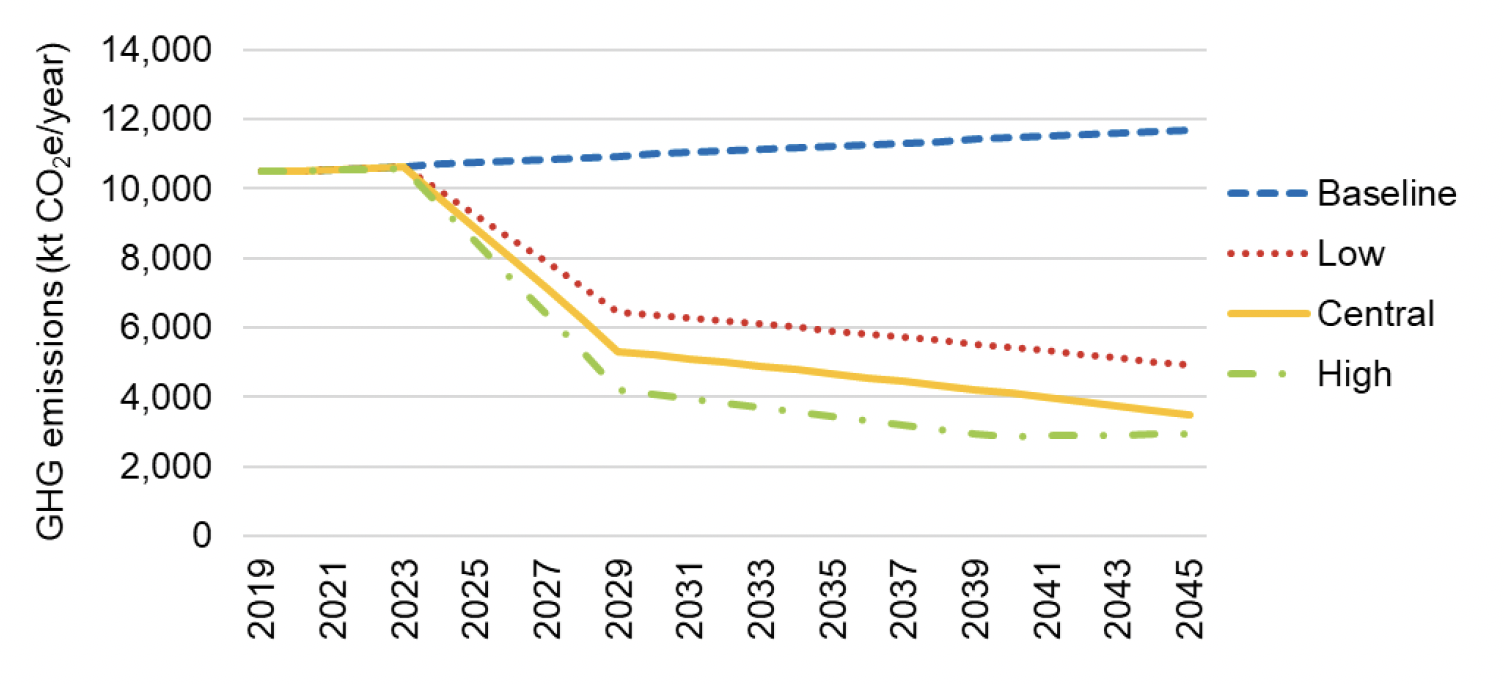
The additional modelling work resulted in slight changes in the modelling outputs, as shown in Figure 7‑3 and Figure 7‑4 below.
7.3.3 Comparison of Phases 1 & 2
Emissions projections from the Industry sector in the baseline scenario and central scenario (for both phases 1 and 2 of the project) are provided below. No changes are observed in the emissions from the sector calculated in the two phases of the project, as updates under Phase 2 were also copied back into Phase 1 results, for consistency.
| Phase | Scenario | Emissions (ktCO2e) | ||||||
|---|---|---|---|---|---|---|---|---|
| 2019 | 2020 | 2025 | 2030 | 2035 | 2040 | 2045 | ||
| n/a | Baseline | 10,491 | 10,496 | 10,748 | 10,994 | 11,231 | 11,461 | 11,683 |
| 1 | Central Growth | 10,491 | 10,495 | 8,866 | 5,216 | 4,671 | 4,097 | 3,497 |
| High Growth | 10,491 | 10,494 | 8,489 | 4,081 | 3,444 | 2,858 | 2,937 | |
| Low Growth | 10,491 | 10,495 | 9,245 | 6,365 | 5,908 | 5,425 | 4,920 | |
| High Hydrogen | 10,491 | 10,495 | 8,370 | 3,704 | 3,122 | 2,883 | 2,964 | |
| Low Hydrogen | 10,491 | 10,495 | 9,362 | 6,737 | 6,226 | 5,684 | 5,119 | |
| 2 | Central Growth | 10,491 | 10,495 | 8,866 | 5,216 | 4,671 | 4,097 | 3,497 |
| High Growth | 10,491 | 10,494 | 8,489 | 4,081 | 3,444 | 2,858 | 2,937 | |
| Low Growth | 10,491 | 10,495 | 9,245 | 6,365 | 5,908 | 5,425 | 4,920 | |
| High Hydrogen | 10,491 | 10,495 | 8,370 | 3,704 | 3,122 | 2,883 | 2,964 | |
| Low Hydrogen | 10,491 | 10,495 | 9,362 | 6,737 | 6,226 | 5,684 | 5,119 | |
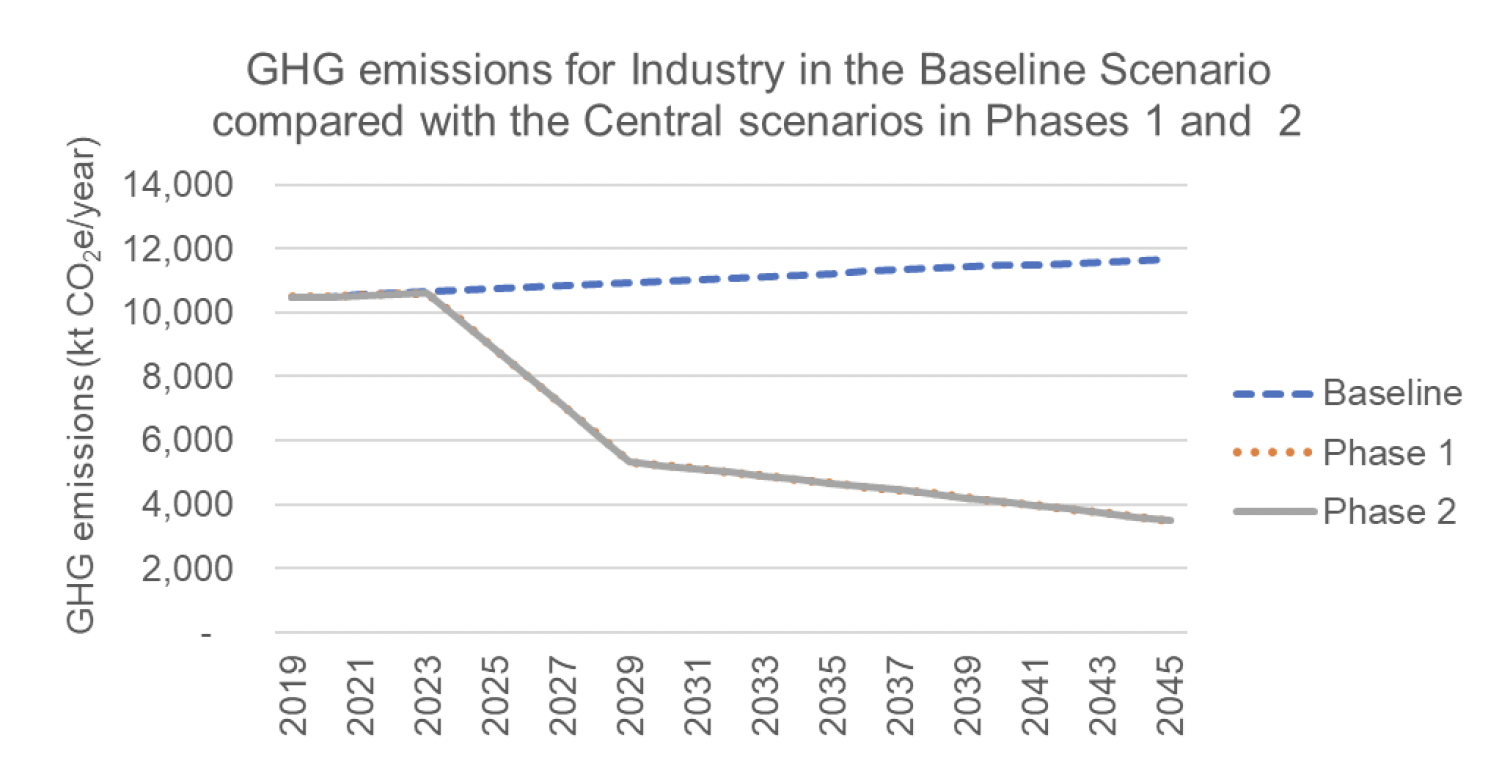
Note: The results from Phases 1 and 2 are visibly almost indistinguishable from each other because of the small magnitude of differences between them.
7.3.4 Emissions reduction by policy package (2032) – Phase 1 & 2
A breakdown of emissions reduction by policy package— I1 (UK ETS) and I2 (Scottish Industrial Energy Transformation Fund) —by scenario in 2032 is provided below. This again shows the marginal differences between the results of the modelling undertaken during phase 1 and phase 2 of the project.
| Policy Package | Emissions reductions by 2032 (ktCO2e) | |||||||||
|---|---|---|---|---|---|---|---|---|---|---|
| Phase 1 | Phase 2 | |||||||||
| Central Growth | High Growth | Low Growth | High Hydrogen | Low Hydrogen | Central Growth | High Growth | Low Growth | High Hydrogen | Low Hydrogen | |
| I1 | -6,013 | -7,178 | -4,842 | -7,551 | -4,476 | -6,013 | -7,178 | -4,842 | -7,551 | -4,476 |
| I2 | -55 | -66 | -44 | -55 | -55 | -78 | -93 | -62 | -78 | -78 |
| Total | -6,069 | -7,244 | -4,886 | -7,606 | -4,531 | -6,091 | -7,271 | -4,904 | -7,629 | -4,554 |
7.4 Uncertainties
In 2019, around 68% of emissions in the Industry sector were produced by sub-sectors covered by the ETS. For emission reductions through the ETS, the overall uncertainty of the industrial sector as a whole achieving the modelled level of emissions by 2045 is expected to be relatively low (perhaps <10%) as it is dictated by the ETS cap. However, there is uncertainty in the years up to 2045 as Scottish industry may decarbonise at a different rate compared to the rest of the UK. This possibility is covered in the High and Low growth scenarios (see 'Sensitivities' section below). There is also uncertainty over how each individual subsector will decarbonise over time which could be ~50% in 2030, with the uncertainty of the emissions in 2045 considerably lower. For non-ETS emissions reductions, the uncertainty throughout the studied period is higher (approx. 50%) due to limitations in available data.
Due to the number of assumptions used, we suggest that the energy use projections are merely indicative. For example, there is a high level of uncertainty associated with the technical and economic characteristics of fuel-switching technologies.
7.5 Sensitivities
High and low growth scenarios reflect possible rates of emission reduction under the ETS in comparison to the rest of the UK. Deviations from the central scenario of ±20% up to 2030 and ±10% thereafter are estimated in the high and low growth scenarios. This reflects the expectation that more significant deviation from the rest of the UK is expected in the short term due to differences in funding allocation for decarbonisation projects within industry.
Variations in trajectory are also considered in the high and low hydrogen pathways, based on "Hydrogen" and "Electrification" emission trajectories in the 'Deep Decarbonisation Pathways for Scottish Industries' report, which consider the expected timeline of key deployments, such as the implementation of CCUS.
Contact
Email: Edward.Mchardy@gov.scot
There is a problem
Thanks for your feedback